

Divisions
- About the Tasmanian State Service
- Contact Us
- Aboriginal employment
- Culture of learning
- Diversity and inclusion
- Digital capability
- Employee surveys
- Employment arrangements
- Employment policy
- Managing performance
- Work health, safety and wellbeing
- Workforce planning and reporting
- Awards and Agreements
- Managing and leading change
- Senior Executives
- Legislation
- Coronavirus (COVID-19) Information for Staff
Contact Details
By phone
Find the number of a specific division or office to contact them directly or call Service Tasmania on 1300 135 513.
Our staff
Use the Tasmanian Government Directory to find staff contact details
Social media
Follow our social media accounts to keep up to date with specific programs and initiatives.
Workforce Profile
In early 2019, SSMO completed a review and validation of employment type coding within agency payroll systems. This process resulted in amendments to the coding of some employees and officers to correctly reflect their appointment type.
These amendments have resulted in adjustments to the historical paid headcount (HC), and paid full-time equivalent (FTE) data reported in the Tasmanian State Service Annual Report 2017-18. The data provided for the 2017-18 period in the following Workforce Profile is the corrected data for this period.[1]
Paid FTE by Agency as at 30 June 2018 and 2019
Agency | 2018 | 2019 | Var. |
|---|---|---|---|
Department of Communities Tasmania[2] | 758.99 | 758.99 | |
Department of Education | 8,171.16 | 8,399.37 | 228.21 |
Department of Health[2] | - | 9,651.77 | 9,651.77 |
Department of Health and Human Services[2] | 1,682.30 | - | -1,682.30 |
Department of Justice | 1,221.01 | 1,295.70 | 74.69 |
Department of Police, Fire and Emergency Management | 872.54 | 904.48 | 31.94 |
Department of Premier and Cabinet[2] | 482.89 | 405.48 | -77.41 |
Department of Primary Industries, Parks, Water and Environment | 1,192.85 | 1,254.44 | 61.59 |
Department of State Growth | 713.78 | 750.53 | 36.75 |
Department of Treasury and Finance | 301.30 | 320.65 | 19.35 |
Tasmanian Audit Office | 37.26 | 45.60 | 8.34 |
Brand Tasmania[3] | - | 3.00 | 3.00 |
Integrity Commission of Tasmania | 12.30 | 13.50 | 1.20 |
Macquarie Point Development Corporation | 8.30 | 7.40 | -0.90 |
Port Arthur Historic Site Management Authority | 102.30 | 102.63 | 0.33 |
Tasmanian Health Service[2] | 8,274.91 | - | -8,274.91 |
TasTAFE | 712.22 | 682.67 | -29.55 |
The Public Trustee | 53.19 | 50.09 | -3.10 |
Tourism Tasmania | 59.82 | 61.60 | 1.78 |
Total | 23,898.13 | 24,707.90 | 809.77 |
As at 30 June 2019, the TSS had a total paid FTE of 24,707.90 employees. This is an increase of 809.77 paid FTE from 23,898.13 as at 30 June 2018.
Illustration below shows percentages average length of service for permanent employees is 13.44 years, down from 13.72 in 2018. The average age is 45.38 years.
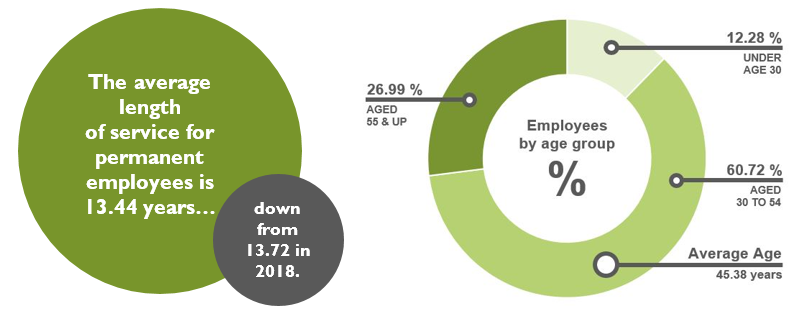
Data table for above chart illustration:
Under age 30 | Aged 30 to 54 | Aged 55 & up | |
|---|---|---|---|
| Percentage of employees | 12.28% | 60.72% | 26.99% |
The total number of employees under age 30 increased to 3,862 paid HC in 2018-19 (from 3,540 in 2017-18).
Paid HC by Agency and Employment Category
Agency | Fixed-term | Perm. | Officer | Total |
|---|---|---|---|---|
Department of Communities Tasmania | 98 | 733 | 14 | 845 |
Department of Education | 2,681 | 8,705 | 22 | 11,408 |
Department of Health | 2,351 | 10,171 | 29 | 12,551 |
Department of Justice | 149 | 1,220 | 29 | 1,398 |
Department of Police, Fire and Emergency Management | 71 | 880 | 9 | 960 |
Department of Premier and Cabinet | 48 | 414 | 17 | 479 |
Department of Primary Industries, Parks, Water and Environment | 234 | 1,149 | 18 | 1,401 |
Department of State Growth | 86 | 768 | 23 | 877 |
Department of Treasury and Finance | 37 | 294 | 16 | 347 |
Tasmanian Audit Office | 17 | 30 | 2 | 49 |
Brand Tasmania | - | 2 | 1 | 3 |
Integrity Commission of Tasmania | 4 | 10 | 1 | 15 |
Macquarie Point Development Corporation | 1 | 6 | 2 | 9 |
Port Arthur Historic Site Management Authority | 38 | 134 | 2 | 174 |
TasTAFE | 100 | 693 | 6 | 799 |
The Public Trustee | 6 | 47 | 1 | 54 |
Tourism Tasmania | 12 | 56 | 2 | 70 |
Total | 5,933 | 25,319 | 194 | 31,439 |
As at 30 June 2019, the TSS had a total paid PHC of 31,439 employees. This is an increase of 1,119 paid HC from 30,320 as at 30 June 2018.
Paid HC by Age Group and Gender
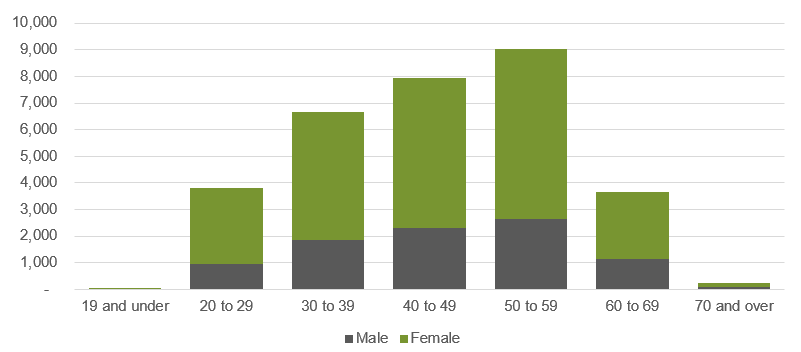
Data table for above chart illustration:
19 and under | 20 to 29 | 30 to 39 | 40 to 49 | 50 to 59 | 60 to 69 | 70 and over | |
|---|---|---|---|---|---|---|---|
| Female | 47 | 2,833 | 4,809 | 5,637 | 6,360 | 2,545 | 156 |
| Male | 23 | 959 | 1,873 | 2,322 | 2,660 | 1,128 | 85 |
Gender Diversity

Illustration above shows percentage female 71.21%, male 28.79% and other <0.01%*
Female | % of TSS | Male | % of TSS | |
|---|---|---|---|---|
Permanent | 18,102 | 57.58 | 7,208 | 22.93 |
Fixed-term | 4,205 | 13.38 | 1,728 | 5.50 |
Officers | 80 | 0.25 | 114 | 0.36 |
Total | 22,387 | 71.21 | 9,050 | 28.79 |
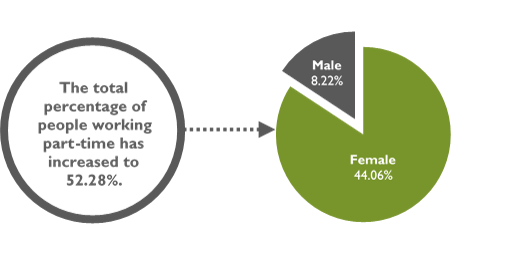
Pie chart illustration above shows the percentage of people working part-time has increased to 52.28%; male at 8.22% and female at 44.06%.
Employment by Region
Fixed-term % | Permanent % | Officer % | Total % | |
|---|---|---|---|---|
Interstate | - | - | - | - |
North | 4.46 | 19.94 | 0.05 | 24.45 |
North West | 3.14 | 14.16 | 0.01 | 17.31 |
South | 9.71 | 41.93 | 0.55 | 52.19 |
South East | 1.39 | 4.02 | 0.01 | 5.42 |
West Coast | 0.17 | 0.45 | - | 0.63 |
Percentage of TSS | 18.87 | 80.51 | 0.62 | 100.00 |
Headcount by Region
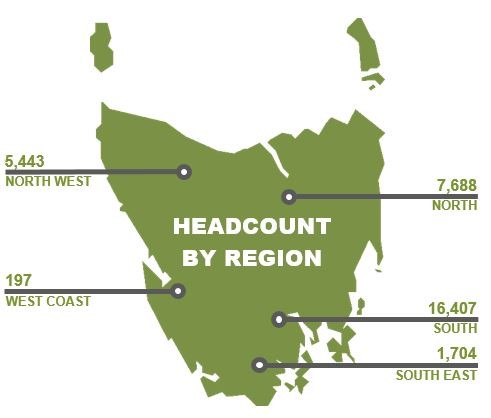
Change in Paid Headcount by Region (2018-19)
Region | Change in Paid Headcount | Headcount |
|---|---|---|
Interstate | - | - |
North | +268 | 7,688 |
North West | +156 | 5,443 |
South | +603 | 16,407 |
South East | +80 | 1,704 |
West Coast | +12 | 197 |
Total | +1,119 | 31,439 |
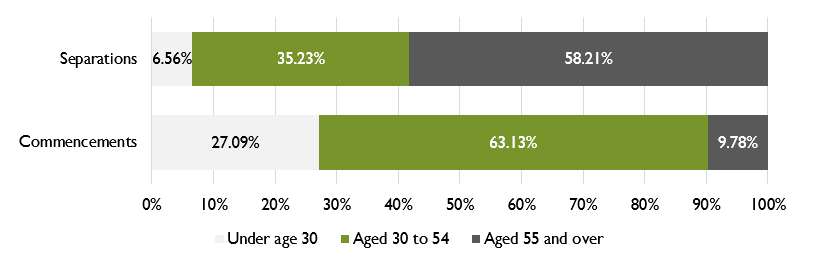
Commencements and Separations
Of the 1,388 permanent employees who left the TSS in 2018-19, 1,291 (93.01%) resigned[4] or retired. The following chart shows the percentage of permanent separations and commencements in each age group during the reporting period.
Data table for above chart illustration :
Under age 30 | Aged 30 to 54 | Aged 55 and over | |
|---|---|---|---|
| Separations | 6.56% | 35.23% | 58.21% |
| Commencements | 27.09% | 63.13% | 9.78% |
Officers
An Officer is anyone appointed under Part 6 of the State Service Act 2000 (the Act), and includes Heads of Agencies, Prescribed Office Holders, Senior Executive Service (SES) and Equivalent Specialists. Overall, the total paid HC of Officers in the TSS decreased over the 2018-19 period to 194 (from 198 in 2017-18).
Male | Female | Total | |
|---|---|---|---|
Heads of Agencies | 11 | 5 | 16 |
Senior Executive Service | 85 | 65 | 150 |
Equivalent Specialists | 17 | 9 | 26 |
Prescribed Office Holders | 1 | 1 | 2 |
Total | 114 | 80 | 194 |
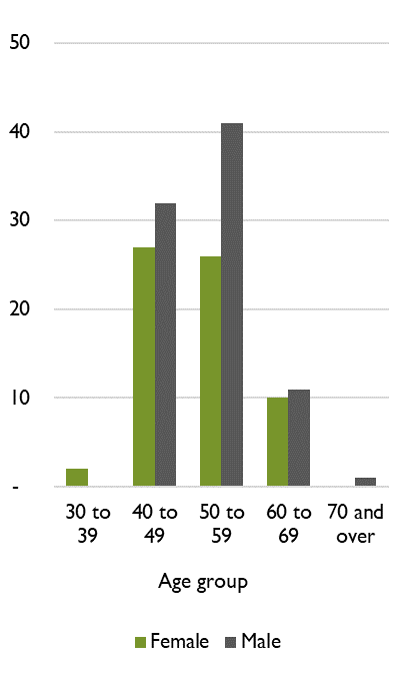
Heads of Agencies and SES By Gender | SES by Gender and Age |
|
|
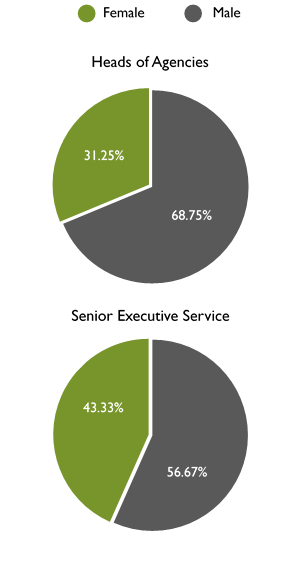
Data table for Heads of Agencies and SES by Gender (above left):
Heads of Agencies | Senior Executive Service | |
|---|---|---|
| Female | 31.25% | 68.75% |
| Male | 43.33% | 56.67% |
Data table for SES by Gender and Age (above right):
Age group | 30 to 39 | 40 to 49 | 50 to 59 | 60 to 69 | 70 and over |
|---|---|---|---|---|---|
| Female | 2 | 27 | 26 | 10 | - |
| Male | - | 32 | 41 | 11 | 1 |
Data Notes
Data included in this Workforce Profile reflects information collected through the Workforce Information Reporting System (WiRS). WiRS is a standardised employee reporting system, validated against a set of business rules and translation tables to ensure consistent reporting at a whole-of-service level. WiRS data only includes those people employed under the State Service Act 2000 (the Act), and within the agencies listed in Schedule 1 of that Act.
Definitions
Paid Headcount (HC) is the number of employees and officers (excluding casuals) engaged and paid as at the reporting date, including employees on paid leave. It excludes employees who were not paid as at the reporting date, such as people on Leave Without Pay or on secondment out of the TSS.
Paid Full-time Equivalent (FTE) is the full-time equivalent value of employees and officers (excluding casuals) who are engaged and paid as at the reporting date (e.g. one person working two part-time roles of 0.5 FTE each equals 1.00 FTE).
Officer/Part 6 is anyone appointed under Part 6 of the Act and includes Heads of Agencies, Prescribed Office Holders, SES and Equivalent Specialists.
For More Information
For more information on any of the information contained in the Profile, contact SSMO via email at ssmo@dpac.tas.gov.au.
This Report and previous Tasmanian State Service Annual Reports can also be viewed on the SSMO website at www.dpac.tas.gov.au/divisions/ssmo/publications.
*To protect the privacy of the low number of employees who identify as a gender other than male or female, data relating to these employees has been included only in totals for Paid HC and Paid FTE, and has not been extracted to identify their agency, age group, employment status or category.
[1] The unamended data can be viewed in the TSS Annual Report 2017-18 available from the SSMO website.
[2] The Department of Communities Tasmania, and the Department of Health were established from 1 July 2018, following the amalgamation of parts of the Department of Health and Human Services, Tasmanian Health Service, and some areas of the Department of Premier and Cabinet.
[3] Brand Tasmania was established on 31 March 2019.
[4] Does not include employees who accepted a Workforce Renewal Incentive Program payment or Voluntary Redundancy package.
Back to: Contents | Previous to: TSS Employee Survey