

Divisions
- About the Tasmanian State Service
- Contact Us
- Aboriginal employment
- Culture of learning
- Diversity and inclusion
- Digital capability
- Employee surveys
- Employment arrangements
- Employment policy
- Managing performance
- Work health, safety and wellbeing
- Workforce planning and reporting
- Awards and Agreements
- Managing and leading change
- Senior Executives
- Legislation
- Coronavirus (COVID-19) Information for Staff
Contact Details
By phone
Find the number of a specific division or office to contact them directly or call Service Tasmania on 1300 135 513.
Our staff
Use the Tasmanian Government Directory to find staff contact details
Social media
Follow our social media accounts to keep up to date with specific programs and initiatives.
2018 TSS Employee Survey
In September 2018, SSMO coordinated the TSS Employee Survey (the Survey) across all agencies. The Survey gave employees and officers the opportunity to contribute their views on accountability, values and principles, and work health and safety. In 2018, the Survey included additional questions about workplace flexibility, development, diversity, and wellbeing, as these areas were identified as whole-of-service workforce management priorities.
The following is an overview of the 2018 Survey results at a whole-of-service level. The full results can be viewed online on the SSMO website here.
In 2018, 8,675 people completed the TSS Employee Survey (a response rate of 29.92%) – this is the highest number of responses since SSMO commenced administration of the Survey in 2011.[1]
Demographics
The demographic profile of respondents to the Survey resembled the demographic profile of the TSS in gender [2] and employment category as at June 2018,[3] however the split of employees by their employment condition showed a greater response rate from employees working on a full-time basis, as shown in the following tables.
Gender | TSS Employees (June 2018) | Survey Respondents |
|---|---|---|
| Female | 71% | 68% |
| Male | 29% | 30% |
| Prefer not to say | 0% | 3% |
Employment category | TSS Employees (June 2018) | Survey Respondents |
|---|---|---|
| Permanent | 81% | 84% |
| Fixed-term | 18% | 13% |
| Officers | 1% | 1% |
Employment condition | TSS Employees (June 2018) | Survey Respondents |
|---|---|---|
| Full-time | 48% | 68% |
| Part-time | 52% | 32% |
Key Indices
An important overall index from the Survey is the level of engagement employees feel. This is calculated through the analysis of percentage agreement scores [4] against the following five questions.
Question | % agreement |
|---|---|
I would recommend my agency as a good place to work. | 63 |
I am proud to tell others I work for my agency. | 69 |
I feel a strong personal attachment to my agency. | 60 |
My agency motivates me to help achieve its objectives. | 54 |
My agency inspires me to do the best in my job. | 56 |
For the first time in 2018, additional high-level indices were included that grouped together related questions in the areas of job satisfaction, diversity and wellbeing. The results for these indices are shown in the following table, along with the overall engagement index.
Index | Level of favourable |
|---|---|
Overall Job Satisfaction | 67 |
Workplace Diversity | 72 |
Wellbeing | 64 |
Engagement | 66 |
Snapshot of Results
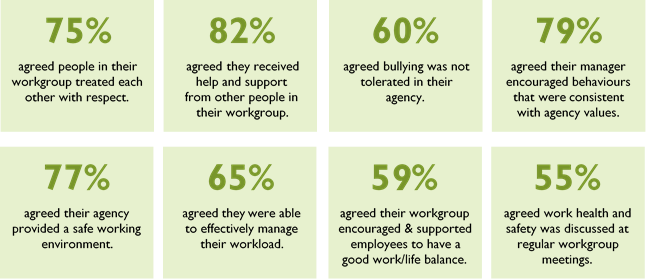
Data for above infographic:
- 75% agreed people in their workgroup treated each other with respect.
- 82% agreed they received help and support from other people in their workgroup.
- 60% agreed bullying was not tolerated in their agency.
- 79% agreed their manager encouraged behaviours that were consistent with agency values.
- 77% agreed their agency provided a safe working environment.
- 65% agreed they were able to effectively manage their workload.
- 59% agreed their workgroup encouraged & supported employees to have a good work/life balance.
- 55% agreed work health and safety was discussed at regular workgroup meetings.
[1] Prior to 2011, the TSS Employee Survey was administered by the Office of the State Service Commissioner.
[2] June 2018 TSS includes <1% of employees who identify as ‘other’. No employees identified as other in the Survey, as a result this gender category has been excluded from this chart.
[3] Current for comparison purposes as at the time of the Survey, which took place between 18 September and 8 October 2018.
[4] The remaining % may include ‘neither agree nor disagree’, or ‘don’t know’, responses and therefore should not be read as meaning the remaining respondents ‘disagree’ or ‘strongly disagree’.
Back to: Contents | Previous to: Workforce Management |
Next to: Workforce Profile