

Divisions
- About the Tasmanian State Service
- Contact Us
- Aboriginal employment
- Culture of learning
- Diversity and inclusion
- Digital capability
- Employee surveys
- Employment arrangements
- Employment policy
- Managing performance
- Work health, safety and wellbeing
- Workforce planning and reporting
- Awards and Agreements
- Managing and leading change
- Senior Executives
- Managing Positions in the State Service (MPSS 2016)
- Legislation
- Coronavirus (COVID-19) Information for Staff
Contact Details
By phone
Find the number of a specific division or office to contact them directly or call Service Tasmania on 1300 135 513.
Our staff
Use the Tasmanian Government Directory to find staff contact details
Social media
Follow our social media accounts to keep up to date with specific programs and initiatives.
2020 State Service Employee Survey
ABOUT THE SURVEY
The 2020 State Service Employee Survey (the Survey) was conducted from 10 to 31 March. The Survey provides all employees and officers with the opportunity to share their perceptions of what it is like to work with the TSS, and provide feedback on what they value as employees.
As in previous years, the 2020 Survey asked questions about a range of topics, including:
- diversity;
- employee engagement;
- workplace health, safety and wellbeing;
- job satisfaction; and
- team work.
The results of the Survey inform the development of whole-of-service and agency-level workforce policies and practices that support employees and contribute to positive working environments, as well as contributing to reporting required under the State Service Act 2000.
The following is an overview of the 2020 Survey results at a whole-of-service level. The full results can be viewed online on the SSMO website26.
In 2020, 6,612 people completed
the State Service Employee Survey
(a response rate of 21.7%).
DEMOGRAPHICS
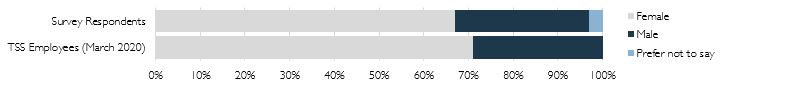
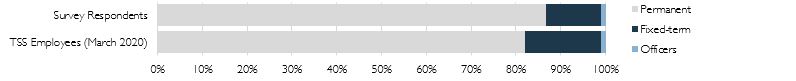
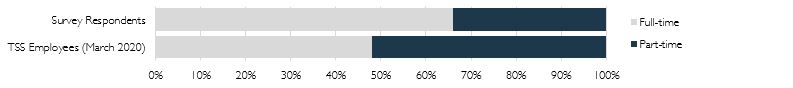
The following charts show the demographic profile of respondents to the Survey in comparison to the demographic profile of the State Service as at March 202027.
The profile of respondents resembled that of the overall TSS in gender28 and employment status, however the split of employees by their employment condition showed a greater response rate from employees working on a full-time basis.
KEY INDICES
High-level indices group together related questions in the areas of job satisfaction, workplace diversity, wellbeing, and engagement. These indices provide an overview of employee perceptions in these areas using a mean (average) index score, and indicate whether employees experience a safe, diverse, and rewarding working environment.
INDEX | 2018 | 2020 |
|---|---|---|
Overall Job Satisfaction | 67 | 67 |
Workplace Diversity | 72 | 73 |
Wellbeing | 64 | 65 |
Engagement | 66 | 65 |
SNAPSHOT OF RESULTS
The following tables show a comparison of percentage agreement responses for the 2018 and 2020 Surveys at a whole-of-service level. The full range of response categories are also shown for the 2020 Survey results.
2020 Total % Agree | 2018 Total % Agree | 2020 Results % | ||||||
|---|---|---|---|---|---|---|---|---|
Question | Strongly Agree | Agree | Neither Agree nor Disagree | Disagree | Strongly Disagree | Don’t Know | ||
People in my workgroup treat each other with respect. | 77 | 75 | 34 | 43 | 12 | 8 | 3 | 0 |
My manager/supervisor has a positive attitude towards employees with diverse backgrounds. | 80 | 78 | 37 | 43 | 11 | 3 | 2 | 4 |
My manager encourages people in my workgroup to monitor and improve the quality of what we do. | 76 | 74 | 36 | 41 | 14 | 7 | 3 | 0 |
My manager expects a high standard of ethical behaviour. | 85 | 85 | 46 | 39 | 9 | 3 | 2 | 1 |
Bullying is not tolerated in my agency. | 62 | 60 | 25 | 38 | 16 | 13 | 7 | 2 |
The people in my work group and colleagues have a positive attitude towards employees with diverse backgrounds. | 81 | 80 | 33 | 48 | 12 | 4 | 2 | 2 |
I would recommend my agency as a good place to work. | 63 | 63 | 20 | 43 | 21 | 10 | 5 | N/A |
I am proud to tell others I work for my agency. | 69 | 69 | 26 | 43 | 21 | 7 | 3 | N/A |
Workplace Bullying and Sexual Harassment
2020 (%) | 2018 (%) | |||||
|---|---|---|---|---|---|---|
Question | Yes | No | Unsure | Yes | No | Unsure |
Have you personally experienced workplace bullying at work in the last 12 months? | 21 | 74 | 5 | 23 | 73 | 4 |
Have you personally experienced sexual harassment at work in the last 12 months? | 2 | 98 | 0 | 2 | 98 | 0 |
26. http://www.dpac.tas.gov.au/divisions/ssmo/employee_survey
27. Current for comparison purposes as at the time of the Survey.
28. The 2020 Survey results and March 2020 workforce data includes <1% of employees who identify as a gender other than male or female, as a result, the ‘other’ category has been excluded from this chart.