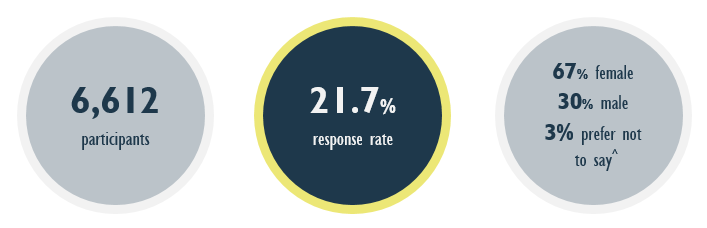
^The Survey supported employees who do not identify as either male or female to select a third gender option, ‘other’. In 2020, less than 1% of Survey participants chose this option.


By phone
Find the number of a specific division or office to contact them directly or call Service Tasmania on 1300 135 513.
Our staff
Use the Tasmanian Government Directory to find staff contact details
Social media
Follow our social media accounts to keep up to date with specific programs and initiatives.
The 2020 State Service Employee Survey (the Survey) was conducted
from 10 to 31 March.
The Survey provides all employees and officers with the opportunity to
share their perceptions of what it is like to work with the Tasmanian State
Service (TSS), and provide feedback on what they value as employees.
As in previous years, the 2020 Survey asked questions about a range of topics, including:
The results of the Survey inform the development of whole-of-service and agency-level workforce policies and practices that support employees and contribute to positive working environments, as well as contributing to reporting required under the State Service Act 2000.
This page provides the Highlights Report, reporting on key whole-of-service results from the 2020 Survey. It can be viewed by navigating through the information on this page, or downloaded in PDF format - 2020 State Service Survey Highlights Report (PDF 354 KB).
^The Survey supported employees who do not identify as either male or female to select a third gender option, ‘other’. In 2020, less than 1% of Survey participants chose this option.
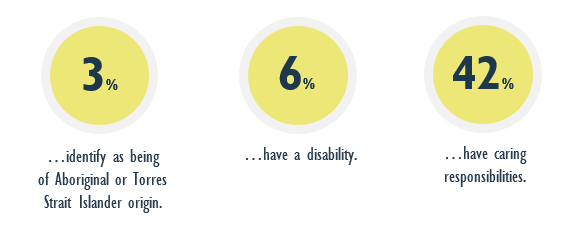
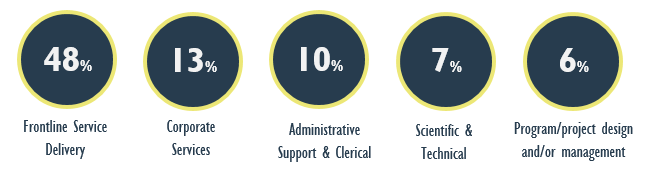
The State Service is committed to building inclusive workplaces that reflect the diversity of the community we serve. The results in this section show the diversity of respondents to the Survey, including their employment status, category, and highest level of formal education.
| EMPLOYMENT STATUS | % |
|---|---|
| Permanent (ongoing) | 85 |
| Fixed-term | 12 |
| Executive Contract* | 1 |
| Casual | 2 |
| EMPLOYMENT CATEGORY | % |
|---|---|
| Full-time | 66 |
| Part-time | 34 |
| AGE | % |
|---|---|
| 15-24 years | 2 |
| 25-34 years | 14 |
| 35-44 years | 23 |
| 45-54 years | 32 |
| 55-64 years | 26 |
| 65 years and over | 3 |
*Heads of Agencies, Prescribed Office Holders, Senior Executive Service (SES) and Equivalent Specialists appointed under Part 6 of the State Service Act 2000.
| EDUCATION | % |
|---|---|
| Doctoral Degree | 2 |
| Master Degree | 11 |
| Graduate Diploma or Graduate Certificate | 17 |
| Bachelor Degree level, including honours | 30 |
| Advanced Diploma or Diploma | 13 |
| Certificate, including trade | 15 |
| Year 12 or equivalent | 6 |
| Less than year 12 or equivalent | 7 |
| REGION | % |
|---|---|
| West Coast | 1 |
| North West | 16 |
| North | 16 |
| South | 58 |
| South East | 5 |
| Outside Tasmania | 0 |
| LENGTH OF SERVICE | % |
|---|---|
| Less than 2 years | 12 |
| 2-5 years | 20 |
| 6-10 years | 16 |
| 11-15 years | 17 |
| 16-20 years | 13 |
| 21 years or more | 22 |
The following table shows the analysis of groups of questions that relate to wellbeing, diversity, job satisfaction, and engagement. These indices provide us with an overview of employee perceptions in these areas using a mean (average) index score, and help us see if we are providing a safe, diverse, and rewarding working environment. The number shown represents the overall agreement for each question group.
| INDEX | AGREEMENT |
|---|---|
| Overall Satisfaction | 67 |
| Agency Engagement | 65 |
| Workplace Diversity | 73 |
| Wellbeing Index | 65 |
The results in the following section expand on the indices in the table above by showing the percentage agreement for key questions in the highlighted areas.
These results help us to further understand the drivers for engagement as well as how employees perceive the importance of the work they do, their work/life balance, and how inclusive their agency is. Through these results we are able to see how committed employees are to working in the State Service.
The questions relating to job satisfaction provide an indication of employee overall contentment with their job and their agency.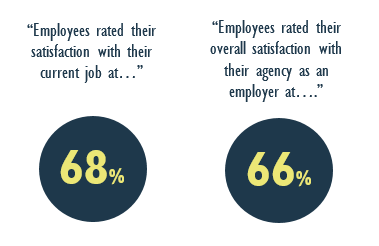
Employee engagement tells us more than how much people like working in their agency, it measures how connected they feel to their agency.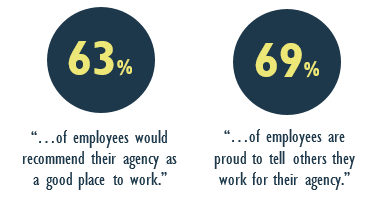
Employee perceptions of how inclusive they believe their agency is are shown below. This includes whether agencies foster inclusive work environments and treat staff with respect.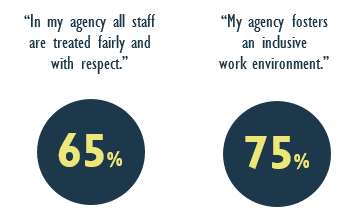
These results tell us how safe and supported employees feel through their perceptions of work/life balance, safety in the workplace, and support for their health and wellbeing. Asking these questions helps agencies to continue providing a safe and supportive working environment.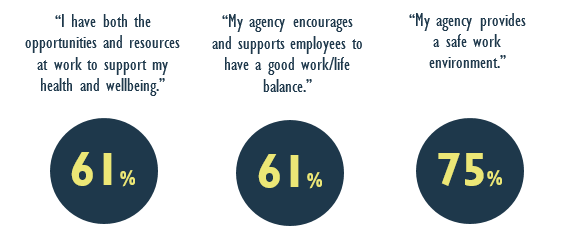
Good working environments are ones where ongoing learning and development is supported, this section shows the results for employee perceptions on learning and development as well as supportive and respectful workplaces.
| % | RESPONSE |
|---|---|
| 84 | ...of employees said their job allowed them to use their skills, knowledge and abilities. |
| 65 | ...said working in their agency gave them the opportunity to maintain or increase their professional knowledge and skills. |
| 78 | ...had discussed their learning and development needs with their manager/supervisor in the past 12 months (formally or informally). |
Employees said they had a conversation about their work performance with their manager/supervisor...
| % | RESPONSE |
|---|---|
| 77 | People in my workgroup treat each other with respect. |
| 76 | My manager encourages people in my workgroup to monitor and improve the quality of what we do. |
| 80 | ...said their manager/supervisor has a positive attitude towards employees with diverse backgrounds. |
| 21 | ...said they personally experienced workplace bullying at work in the last 12 months. |
| 2 | ...said they personally experienced sexual harassment at work in the last 12 months. |
| 85 | My manager expects a high standard of ethical behaviour. |
| 62 | Bullying is not tolerated in my agency. |
| 81 | ...said their colleagues have a positive attitude towards employees with diverse backgrounds. |
The following two questions were optional, and aimed to capture what employees found to be the most rewarding thing about their work, and what they thought could be improved on.
The first question provided 13 key aspects that employees felt helped them to do the best in their job. Employees were able to select up to three options, and the following shows the combined top five results.
| % | RESPONSE |
|---|---|
| 47 | Working in a good team environment. |
| 46 | Serving the Tasmanian community and making a difference to it. |
| 37 | Job security. |
| 36 | Using the skills I have. |
| 24 | The range of people with whom I work. |
The second question focused on areas that could be improved on. Employees were able to select up to three options, and the following shows the combined top five results.
| % | RESPONSE |
|---|---|
| 38 | Training and development opportunities. |
| 33 | Management/leadership. |
| 32 | Focus on positive work behaviours/cultures. |
| 28 | Work/life balance/flexible work provisions. |
| 28 | Communication on organisational objectives/activities. |
The Department of Premier and Cabinet’s (DPAC) State Service Management Office (SSMO) coordinates the Survey across all agencies. The Survey is provided by Orima Research Pty Ltd. The Survey asks all TSS employees and officers about their work and work environment and is conducted on a voluntary basis.
Responses to the Survey are collected, stored and analysed using methods that ensure anonymity and confidentiality, as required under the State Service Act 2000 and Personal Information Protection Act 2004. For more information, please refer to the Frequently Asked Questions page.
If you have any questions about the whole-of-service Survey results, please contact tss.surveys@dpac.tas.gov.au.