

Divisions
- About the Tasmanian State Service
- Contact Us
- Aboriginal employment
- Culture of learning
- Diversity and inclusion
- Digital capability
- Employee surveys
- Employment arrangements
- Employment policy
- Managing performance
- Work health, safety and wellbeing
- Workforce planning and reporting
- Awards and Agreements
- Managing and leading change
- Senior Executives
- Legislation
- Coronavirus (COVID-19) Information for Staff
Contact Details
By phone
Find the number of a specific division or office to contact them directly or call Service Tasmania on 1300 135 513.
Our staff
Use the Tasmanian Government Directory to find staff contact details
Social media
Follow our social media accounts to keep up to date with specific programs and initiatives.
State Service Workforce Report No 2 of 2025
This report provides information about the Tasmanian State Service (TSS) workforce and is published twice yearly.
Overview
Data in this Workforce Profile comes from Agency fortnightly reporting to the State Service Management Office as at 2 July 2025 and from the Workforce Information Reporting System (WiRS) as at the last pay date in June 2025.
Data includes only State Service employees and officers in agencies listed in Schedule 1 of the State Service Act 2000.
WiRS is a standardised employee reporting system, validated against a set of business rules and translation tables to ensure consistent reporting at a whole-of-service level. Data is uploaded to WiRS on a quarterly basis and manually reviewed for quality. Corrections may cause inconsistencies in historical data compared to previous reports and/or previously published State Service or Agency data.
Gender
From June 2018, the State Service's Empower Human Resources Information System supports the recording of a third gender option (Other - Indeterminate/Intersex/Unspecified). From June 2021, some agencies commenced providing employees with the option to not disclose their gender (Undisclosed). To protect the privacy of the low number of employees who do not identify as male or female, or who do not wish to disclose their gender, data in this Report relating to these employees has been included only in totals and has not been extracted to identify their agency, age group, or employment status/category.
Definitions
Paid Headcount (PHC) is an indicative number of employees and officers (excluding casuals) engaged and paid as at the reporting date, including employees on paid leave. It excludes employees who were not paid as at the reporting date, such as people on Leave Without Pay or on secondment out of the State Service. As this data is based on payroll, as opposed to establishment, headcount numbers reported here will differ to those reported by agencies.
Paid Full-time Equivalent (FTE) is the full-time equivalent value of employees and officers (excluding casuals) who are engaged and paid as at the reporting date (e.g. two people working in a part-time role of 0.5FTE each equals 1.00 full-time equivalent).
An Officer is anyone appointed under Part 6 of the Act and includes Heads of Agencies, Prescribed Office Holders, Senior Executive Service, and Equivalent Specialists.
Employees by Agency and Employment Category
Paid Headcount as at 30 June 2025
The total paid headcount (PHC) increased by 415 from 35,750 in December 2024. The increase occurred mainly in the fixed-term category (from 4,575 in December), and within the Department of Education, Children and Young People.
Agency | Fixed-term | Permanent | Part 6 | Total |
|---|---|---|---|---|
Department for Education, Children and Young People | 2,610 | 10,376 | 53 | 13,039 |
Department of Health | 2,269 | 13,437 | 30 | 15,736 |
Department of Justice | 189 | 1,621 | 31 | 1,841 |
Department of Police, Fire and Emergency Management | 144 | 1,122 | 16 | 1,282 |
Department of Premier and Cabinet | 89 | 501 | 34 | 624 |
Department of Natural Resources and Environment Tasmania | 240 | 1,240 | 22 | 1,502 |
Department of State Growth | 128 | 930 | 39 | 1,097 |
Department of Treasury and Finance | 26 | 309 | 15 | 350 |
Audit Tasmania | 4 | 51 | 2 | 57 |
Brand Tasmania | 3 | 3 | 1 | 7 |
Environment Protection Authority | 6 | 118 | 3 | 127 |
Homes Tasmania | 22 | 164 | 4 | 190 |
Integrity Commission of Tasmania | 1 | 15 | 1 | 17 |
Macquarie Point Development Corporation | 1 | 12 | 3 | 16 |
Port Arthur Historic Site Management Authority | 11 | 114 | 2 | 127 |
The Public Trustee | 6 | 71 | 1 | 78 |
Tourism Tasmania | 13 | 62 | 3 | 78 |
Total | 5,762 | 30,146 | 260 | 36,168 |
Paid Full-time Equivalent as at 30 June 2025
The total paid FTE increased by 1,301.68 in the June 2025 quarter from 28,485.62 paid FTE in December 2024.
Agency | Fixed-term | Permanent | Part 6 | Total |
|---|---|---|---|---|
Department for Education, Children and Young People | 1,709.59 | 8,399.15 | 52.40 | 10,161.14 |
Department of Health | 1,886.52 | 10,919.85 | 29.20 | 12,835.57 |
Department of Justice | 173.52 | 1,535.83 | 30.91 | 1,740.26 |
Department of Police, Fire and Emergency Management | 129.64 | 1,071.53 | 16.00 | 1,217.17 |
Department of Premier and Cabinet | 79.00 | 444.80 | 33.90 | 557.70 |
Department of Natural Resources and Environment Tasmania | 200.22 | 1,150.62 | 22.00 | 1,372.84 |
Department of State Growth | 116.08 | 789.39 | 38.30 | 943.77 |
Department of Treasury and Finance | 26.00 | 286.49 | 15.00 | 327.49 |
Audit Tasmania | 3.00 | 48.19 | 2.00 | 53.19 |
Brand Tasmania | 3.00 | 3.00 | 1.00 | 7.00 |
Environment Protection Authority | 5.80 | 107.70 | 3.00 | 116.50 |
Homes Tasmania | 20.05 | 154.88 | 4.00 | 178.93 |
Integrity Commission of Tasmania | 0.20 | 13.70 | 1.00 | 14.90 |
Macquarie Point Development Corporation | 1.00 | 11.72 | 3.00 | 15.72 |
Port Arthur Historic Site Management Authority | 7.55 | 94.80 | 2.00 | 104.35 |
The Public Trustee | 5.40 | 67.34 | 1.00 | 73.74 |
Tourism Tasmania | 12.01 | 53.81 | 3.00 | 68.82 |
Total | 4,378.58 | 25,152.80 | 257.71 | 29,789.09 |
Paid Headcount across the State Service
Percentage of total Paid Headcount by Employment Status
Our largest employee group continues to be women working in a part-time capacity (44.42%). There has been a small decrease in full-time employment (2.08%) since December 2024.
Full-time | Part-time | ||
|---|---|---|---|
Female % | Male % | Female % | Male % |
27.16 | 18.52 | 44.42 | 9.62 |
Paid Headcount by Age and Gender
The gender balance shifted slightly between December 2024 and June 2025, with the percentage of female employees increasing from 71.39% to 71.58%, compared to the percentage of male employees which decreased from 28.36% to 28.14%. The remaining 0.28% represents employees who do not identify as either male or female or who have not disclosed their gender to their agency.
The percentage of employees under the age of 30 increased from 12.92% in December 2024 to 14.24% in June 2025. The average length of service for permanent employees decreased to 11.05 years as at June 2025 from 11.12 years as at December 2024.
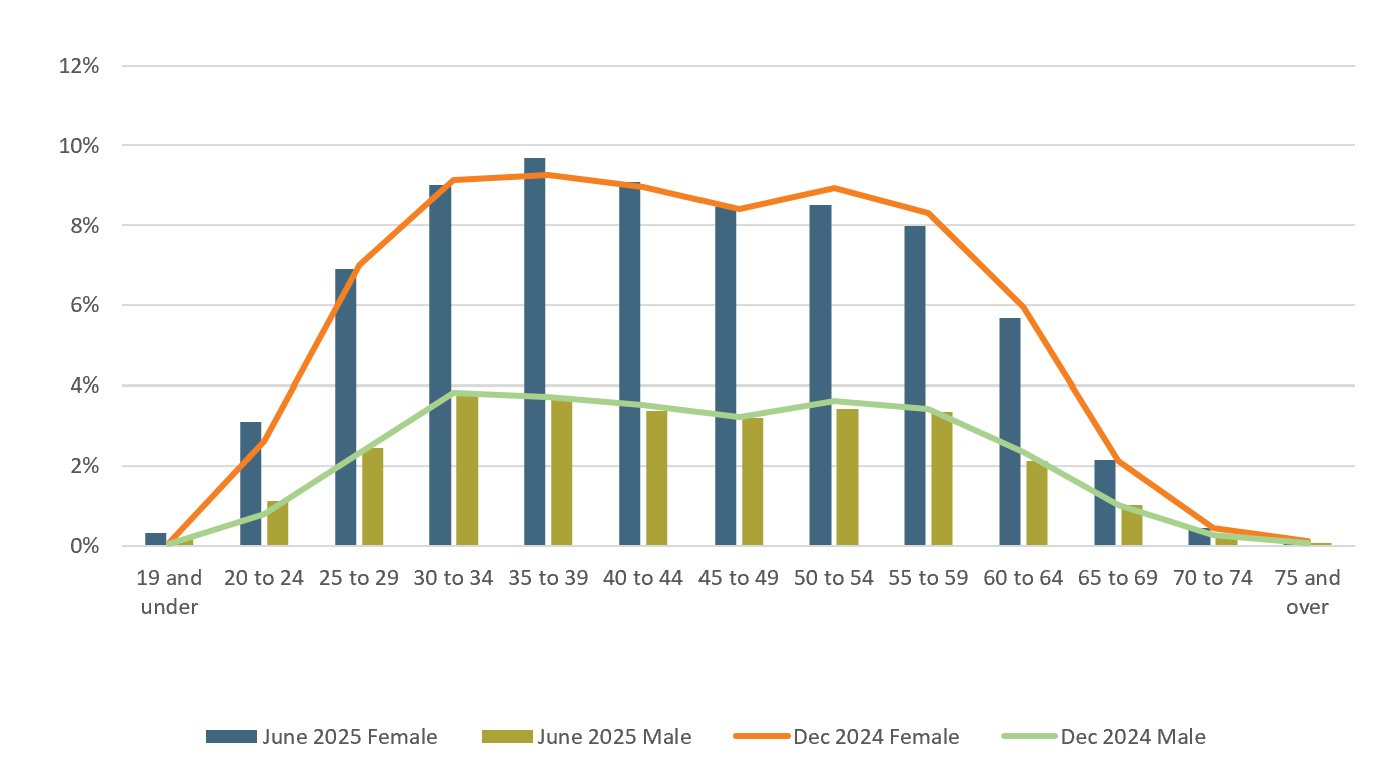
Age Group | Dec - Female | Dec - Male | June - Female | June - Male |
19 and under | 0.09% | 0.05% | 0.34% | 0.18% |
20 to 24 | 2.63% | 0.82% | 3.11% | 1.14% |
25 to 29 | 7.00% | 2.33% | 6.92% | 2.46% |
30 to 34 | 9.13% | 3.83% | 9.01% | 3.79% |
35 to 39 | 9.28% | 3.73% | 9.69% | 3.67% |
40 to 44 | 8.96% | 3.54% | 9.09% | 3.39% |
45 to 49 | 8.40% | 3.24% | 8.46% | 3.20% |
50 to 54 | 8.93% | 3.64% | 8.52% | 3.44% |
55 to 59 | 8.32% | 3.44% | 7.99% | 3.37% |
60 to 64 | 5.95% | 2.35% | 5.69% | 2.14% |
65 to 69 | 2.12% | 1.04% | 2.16% | 1.03% |
70 to 74 | 0.46% | 0.27% | 0.45% | 0.26% |
75 and over | 0.12% | 0.08% | 0.14% | 0.08% |
Total | 71.39% | 28.36% | 71.58% | 28.14% |
Paid Headcount by Region and Employment Category
Employee percentages increased in every region across the State in the quarter ending June 2025.
Region | Fixed term | Permanent | Part 6 | Total |
|---|---|---|---|---|
North | 23.34% | 24.19% | 4.65% | 23.92% |
North West | 15.99% | 16.74% | 0.78% | 16.51% |
South | 53.51% | 53.65% | 93.41% | 53.90% |
South East | 6.63% | 4.96% | 1.16% | 5.21% |
West Coast | 0.53% | 0.46% | 0.00% | 0.46% |
Separations and Commencements
Of the 497 permanent employees who left the State Service in the quarter ending June 2025, a total of 483 (97.18%) resigned. The following charts show the number of permanent employees (by age group) who separated from or commenced with the State Service in the quarter ending June 2025, as compared to the quarter ending December 2024.
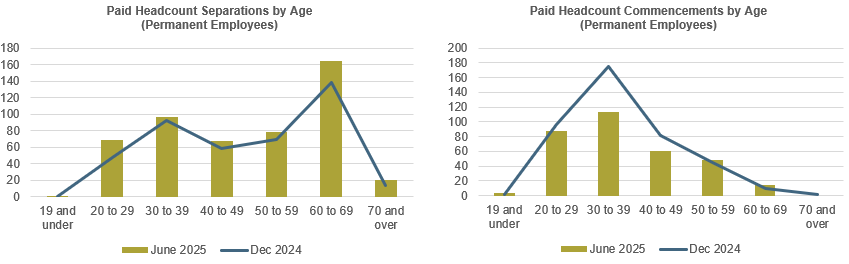
Resignations include employees who accepted a Workforce Renewal Incentive Program payment or Voluntary Redundancy package, resigned or retired from the State Service.
Officers
An Officer is anyone appointed under Part 6 of the State Service Act 2000 and includes Heads of Agency, Prescribed Office Holders, members of the Senior Executive Service, and Equivalent Specialists.
As at June 2025 the total number of Officers in the State Service was 258, this is an increase from 254 in December 2024.
Type | June 2025 | ||
|---|---|---|---|
Female | Male | Total | |
Head of Agency | 9 | 7 | 16 |
Prescribed Office Holder | 2 | 2 | 4 |
Senior Executive Service | 115 | 99 | 214 |
Equivalent Specialist | 11 | 14 | 25 |
Total | 137 | 122 | 259 |
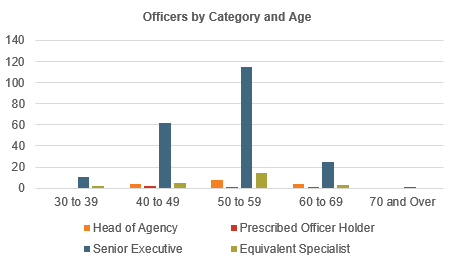
Category | 30 to 39 | 40 to 49 | 50 to 59 | 60 to 69 | 70 and over | Total |
|---|---|---|---|---|---|---|
Head of Agency | 0 | 4 | 8 | 4 | 0 | 16 |
Prescribed Officer Holder | 0 | 2 | 1 | 1 | 0 | 4 |
Senior Executive | 11 | 62 | 115 | 25 | 1 | 214 |
Equivalent Specialist | 2 | 5 | 15 | 3 | 0 | 25 |
Total | 13 | 73 | 139 | 33 | 1 | 259 |
More Info
For more information on any of the information contained in this profile, contact the State Service Management Office via email to ssmo@dpac.tas.gov.au.
The next State Service Workforce Report will be published at the end of April 2026.