

Divisions
- About the Tasmanian State Service
- Contact Us
- Aboriginal employment
- Culture of learning
- Diversity and inclusion
- Digital capability
- Employee surveys
- Employment arrangements
- Employment policy
- Managing performance
- Work health, safety and wellbeing
- Workforce planning and reporting
- Awards and Agreements
- Managing and leading change
- Senior Executives
- Legislation
- Coronavirus (COVID-19) Information for Staff
Contact Details
By phone
Find the number of a specific division or office to contact them directly or call Service Tasmania on 1300 135 513.
Our staff
Use the Tasmanian Government Directory to find staff contact details
Social media
Follow our social media accounts to keep up to date with specific programs and initiatives.
Workforce Profile
PAID FULL-TIME EQUIVALENT BY AGENCY AS AT 30 JUNE 2020 AND 2021
AGENCY | 2020 | 2021 | VAR. |
|---|---|---|---|
Department of Communities Tasmania | 771.40 | 803.73 | 32.33 |
Department of Education | 8,416.75 | 8,522.53 | 105.78 |
Department of Health | 10,082.12 | 10,622.50 | 540.38 |
Department of Justice | 1,397.59 | 1,425.19 | 27.60 |
Department of Police, Fire and Emergency Management | 960.47 | 1,007.88 | 47.41 |
Department of Premier and Cabinet | 383.68 | 390.81 | 7.13 |
Department of Primary Industries, Parks, Water and Environment | 1,235.54 | 1,334.35 | 98.81 |
Department of State Growth | 746.71 | 797.47 | 50.76 |
Department of Treasury and Finance | 303.68 | 305.87 | 2.19 |
Tasmanian Audit Office | 41.65 | 43.91 | 2.26 |
Brand Tasmania | 5.00 | 6.00 | 1.00 |
Integrity Commission of Tasmania | 13.20 | 15.10 | 1.90 |
Macquarie Point Development Corporation | 8.70 | 9.93 | 1.23 |
Port Arthur Historic Site Management Authority | 101.83 | 102.36 | 0.53 |
TasTAFE | 704.30 | 772.86 | 68.56 |
The Public Trustee | 55.70 | 53.75 | -1.95 |
Tourism Tasmania | 60.52 | 60.30 | -0.22 |
TOTAL | 25,288.84 | 26,274.54 | 985.70 |
As at 30 June 2021, the TSS had a total paid headcount of 33,416 employees.
This is an increase of 1,418 paid headcount (from 31,998 as at 30 June 2020).
Employees by Age Group
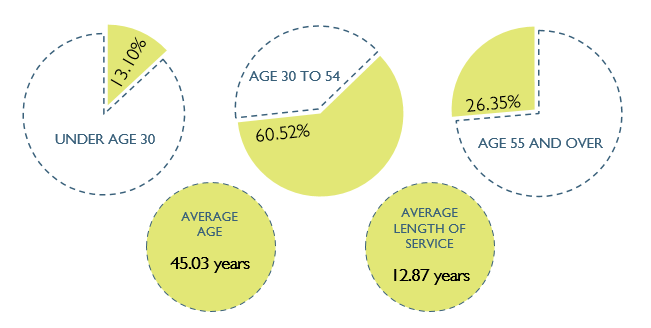
Data represented in this graphic appears in the table below.
| Age Group | % of TSS |
|---|---|
| Under age 30 | 13.10 |
| Aged 30 to 54 | 60.52 |
| Aged 55 and up | 26.35 |
The average age of TSS employees as at June 2021 was 45.03 years. The average length of service for permanent employees is 12.87 years, which is down from 13.14 years in 2020.
Paid Headcount by Agency and Employment Category
AGENCY | FIXED-TERM | PERM. | OFFICER | TOTAL |
|---|---|---|---|---|
Department of Communities Tasmania | 123 | 755 | 16 | 894 |
Department of Education | 2,507 | 9,043 | 27 | 11,577 |
Department of Health | 2,419 | 11,446 | 36 | 13,901 |
Department of Justice | 184 | 1,326 | 29 | 1,539 |
Department of Police, Fire and Emergency Management | 90 | 958 | 13 | 1,061 |
Department of Premier and Cabinet | 82 | 371 | 15 | 468 |
Department of Primary Industries, Parks, Water and Environment | 301 | 1,186 | 15 | 1,502 |
Department of State Growth | 94 | 795 | 31 | 920 |
Department of Treasury and Finance | 32 | 283 | 16 | 331 |
Tasmanian Audit Office | 10 | 36 | 2 | 48 |
Brand Tasmania | 1 | 3 | 2 | 6 |
Integrity Commission of Tasmania | 3 | 12 | 1 | 16 |
Macquarie Point Development Corporation | 3 | 7 | 2 | 12 |
Port Arthur Historic Site Management Authority | 8 | 120 | 1 | 129 |
TasTAFE | 68 | 813 | 5 | 886 |
The Public Trustee | 7 | 51 | 1 | 59 |
Tourism Tasmania | 11 | 54 | 2 | 67 |
TOTAL | 5,943 | 27,259 | 214 | 33,416 |
The total number of employees under age 30 increased
to 4,378 paid headcount in 2020-21 (from 3,994 in 2019-20).
PAID HEADCOUNT BY AGE GROUP AND GENDER
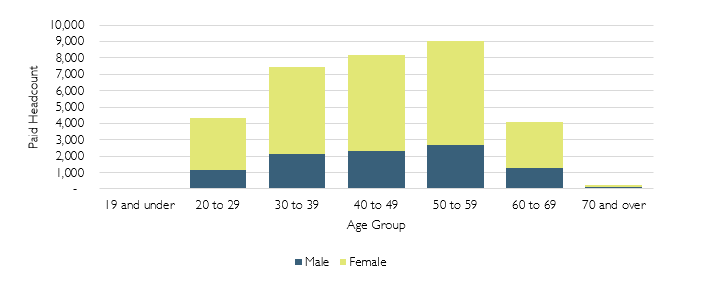
Data represented in this chart appears in the table below.
| Age Group | Female | Male |
|---|---|---|
| 19 and under | 43 | 18 |
| 20 to 29 | 3,177 | 1,138 |
| 30 to 39 | 5,306 | 2,162 |
| 40 to 49 | 5,807 | 2,344 |
| 50 to 59 | 6,377 | 2,660 |
| 60 to 69 | 2,835 | 1,273 |
| 70 and over | 168 | 97 |
| Total | 23,713 | 9,692 |
GENDER DIVERSITY
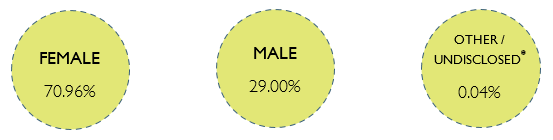
| EMPLOYMENT STATUS | FEMALE | % OF TSS | MALE | % OF TSS |
|---|---|---|---|---|
Permanent | 19,485 | 58.31 | 7,738 | 23.25 |
Fixed-term | 4,135 | 12.37 | 1,803 | 5.40 |
Officers | 93 | 0.28 | 121 | 0.36 |
TOTAL | 23,713 | 70.96 | 9,692 | 29.00 |
EMPLOYMENT BY REGION
FIXED-TERM % | PERMANENT % | OFFICER % | TOTAL % | |
|---|---|---|---|---|
Interstate | - | - | - | - |
North | 3.92 | 19.89 | 0.04 | 23.85 |
North West | 2.97 | 14.10 | 0.01 | 17.09 |
South | 9.64 | 43.19 | 0.58 | 53.41 |
South East | 1.12 | 3.96 | 0.01 | 5.09 |
West Coast | 0.13 | 0.44 | 0.00 | 0.57 |
TOTAL % | 17.78 | 81.57 | 0.64 | 100.00 |
PAID HEADCOUNT BY REGION (2020-21)
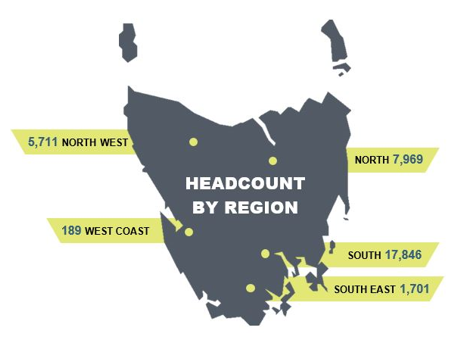
REGION | VARIATION |
|---|---|
Interstate | - |
North | +265 |
North West | +219 |
South | +918 |
South East | +28 |
West Coast | -12 |
TOTAL | +1,418 |
COMMENCEMENTS AND SEPARATIONS
Of the 1,470 permanent employees who left the State Service in the 2020-21 period, 1,400 (95.24%) resigned22 or retired. The following chart shows the percentage of permanent separations and commencements in each age group during the reporting period.
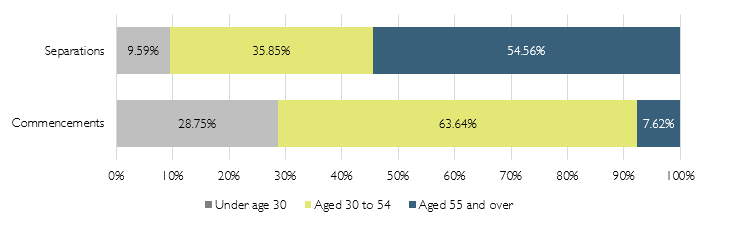
Data represented in this chart appears in the table below.
| Age Group | Commencements | Separations |
|---|---|---|
| Under age 30 | 29.14% | 8.63% |
| Aged 30 to 54 | 60.50% | 32.78% |
| Aged 55 and over | 10.36% | 58.59% |
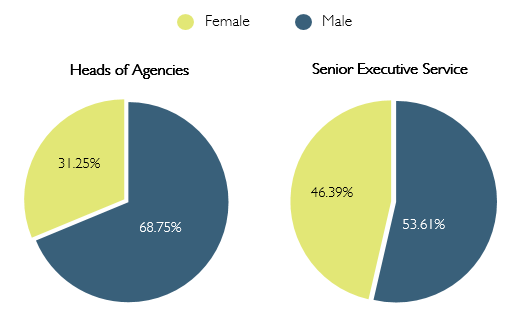
OFFICERS
An Officer is anyone appointed under Part 6 of the State Service Act 2000 (the Act), and includes Heads of Agencies, Prescribed Office Holders, Senior Executive Services (SES) and Equivalent Specialists. Overall, the total paid headcount of Officers in the State Service increased over the 2020-21 period to 214 (from 211 in 2019-20).
| OFFICER | MALE | FEMALE | TOTAL |
|---|---|---|---|
Heads of Agencies | 11 | 5 | 16 |
Senior Executive Service | 89 | 77 | 166 |
Equivalent Specialists | 20 | 10 | 26 |
Prescribed Office Holders | 1 | 1 | 2 |
Total | 121 | 93 | 214 |
HEADS OF AGENCIES AND SES BY GENDER
SES BY GENDER AND AGE GROUP
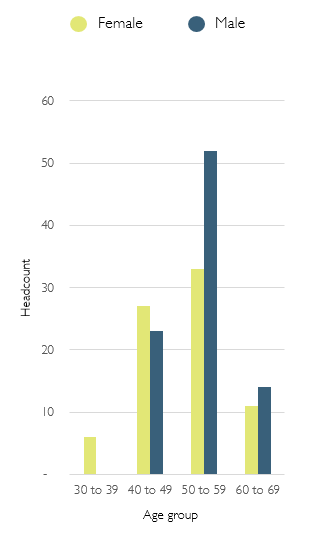
Data represented in this chart appears in the table below.
| Senior Executive | 30 to 39 | 40 to 49 | 50 to 59 | 60 to 69 | 70 and over | Total |
|---|---|---|---|---|---|---|
| Female | 6 | 27 | 33 | 11 | - | 77 |
| Male | - | 23 | 52 | 14 | - | 89 |
| Total | 6 | 50 | 85 | 25 | - | 166 |
DATA NOTES
Data included in this Workforce Profile reflects information collected through the Workforce Information Reporting System (WiRS). WiRS is a standardised employee reporting system, validated against a set of business rules and translation tables to ensure consistent reporting at a whole-of-service level. WiRS data only includes those people employed under the State Service Act 2000 (the Act), and within the agencies listed in Schedule 1 of that Act23.
Data is uploaded to WiRS on a quarterly basis and manually reviewed as part of an ongoing quality assurance process. This process may include the correction of coding errors that affect historical paid headcount or full-time equivalent data. As a result of these corrections, there may be inconsistencies in historic data shown in this Report when compared to previously published State Service and Agency Annual Reports.
Gender
From June 2018, the State Service's Empower Human Resources Information System supports the recording of a third gender option (Other). From June 2021, some agencies commenced providing employees with the option to not disclose their gender (Undisclosed). To protect the privacy of the low number of employees who do not identify as male or female, or who do not wish to disclose their gender, data in this Report relating to these employees has been included only in totals and has not been extracted to identify their agency, age group, or employment status/category.
Definitions
Paid Headcount is an indicative number of employees and officers (excluding casuals) employed and paid as at the reporting date, including employees on paid leave. It excludes employees who were not paid as at the reporting date, such as people on Leave Without Pay or on secondment out of the State Service. As this data is based on payroll, as opposed to establishment, headcount numbers reported here will differ to those reported by agencies.
Paid Full-time Equivalent is the full-time equivalent value of employees and officers (excluding casuals) who are employed and paid as at the reporting date (e.g. two employees each working in a part-time role of 0.5 full-time equivalent combine to equal 1.00 full-time equivalent).
An Officer is anyone appointed under Part 6 of the Act and includes Heads of Agencies, Prescribed Office Holders, Senior Executive Service, and Equivalent Specialists.
For More Information
For more information on any of the information contained in the Profile, contact SSMO via email at ssmo@dpac.tas.gov.au.
This Report and previous Tasmanian State Service Annual Reports can be viewed on the SSMO website at http://www.dpac.tas.gov.au/divisions/ssmo/about_ssmo/annual_reports
22. Does not include employees who accepted a Workforce Renewal Incentive Program payment or Voluntary Redundancy package.
23. https://www.legislation.tas.gov.au/view/html/inforce/current/act-2000-085#JS1@EN