
Divisions
- About the Tasmanian State Service
- Contact Us
- Aboriginal employment
- Culture of learning
- Diversity and inclusion
- Digital capability
- Employee surveys
- Employment arrangements
- Employment policy
- Managing performance
- Work health, safety and wellbeing
- Workforce planning and reporting
- Awards and Agreements
- Managing and leading change
- Senior Executives
- Legislation
- Coronavirus (COVID-19) Information for Staff
Contact Details
By phone
Find the number of a specific division or office to contact them directly or call Service Tasmania on 1300 135 513.
Our staff
Use the Tasmanian Government Directory to find staff contact details
Social media
Follow our social media accounts to keep up to date with specific programs and initiatives.
Our Workforce
Our Workforce – at a glance 30 June 2015
Workforce - our people
We have a diverse workforce of 27 529 people. This compares to 28 310 last year so our workforce has reduced by 781. Or in paid FTE terms, our workforce decreased by 744.21 this year to 21 736.*
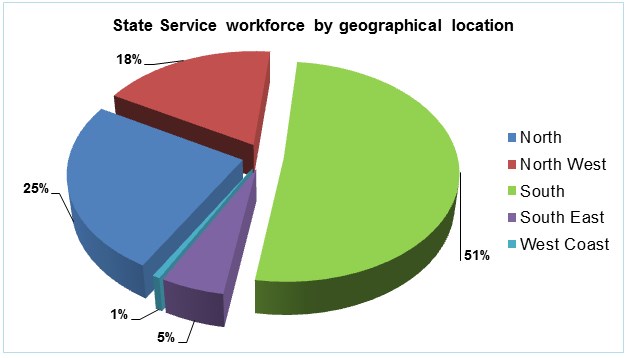
Where do they work?
|
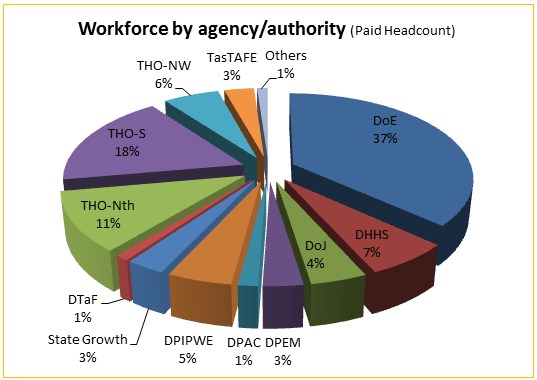 The Department of Education is our largest agency with over 10,000 employees. Our smallest organisation is the Macquarie Point Development Corporation authority with
9 employees.
The Department of Education is our largest agency with over 10,000 employees. Our smallest organisation is the Macquarie Point Development Corporation authority with
9 employees.Age and Gender
*Note: This Workforce Overview presents information collected through the Workplace Analysis and Collection Application (WACA) system. Treasury reported data on Paid FTEs is collected using different capture rules and requirements, such as rules for calculating casuals.
The average age of the workforce is 45.82 years (45.48 in 2014)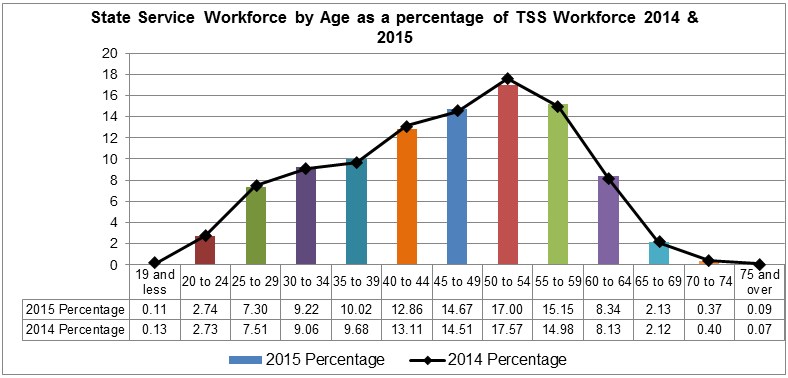
Employment Status
Workforce Composition
14.66 % - Fixed-term
0.66 % - Senior Executive Service/Equivalent Specialists
84.68 % - Permanent
Employment Category
13 705 people work part-time – 85.06% of the part-time workforce are women and 14.94% are men.
Part-time employment represents 49.78% of the workforce (48.54% - 2014).
14 224 people work full-time (represents 51.67% of the workforce)
Work Location