

Divisions
- About the Tasmanian State Service
- Contact Us
- Aboriginal employment
- Culture of learning
- Diversity and inclusion
- Digital capability
- Employee surveys
- Employment arrangements
- Employment policy
- Managing performance
- Work health, safety and wellbeing
- Workforce planning and reporting
- Awards and Agreements
- Managing and leading change
- Senior Executives
- Legislation
- Coronavirus (COVID-19) Information for Staff
Contact Details
By phone
Find the number of a specific division or office to contact them directly or call Service Tasmania on 1300 135 513.
Our staff
Use the Tasmanian Government Directory to find staff contact details
Social media
Follow our social media accounts to keep up to date with specific programs and initiatives.
Appendix C – Workforce Profile
Who we are
As at June 2015 the Tasmanian State Service has a total paid headcount of 27 529 (28 310 in 2014) which equates to 21 736 paid full-time equivalent employees (FTEs) (22 480.29 in 2014)*. In total the year 2014-15 saw a total reduction of 744.29 Paid FTEs across the Service.**
The total number of employees under the age of 30 fell slightly from 2 938 to 2 794 over the year, and the average age of our workforce rose from 45.78 years in 2014 to 45.82 years. For permanent employees, the average length of service rose slightly to 12.46 years from 12.34 years in 2014.
* Unless otherwise stated, all totals and averages are based on paid permanent and fixed-term employee numbers, and exclude casual employees.
**The TSS Workforce Profile presents information collected through the Workforce Analysis and Collection Application (WACA) system. Treasury reported data on Paid FTEs is collected using different capture rules and requirements, such as rules for calculating casuals.
Percentage of total Paid Headcount by Employment Status and Sex
Our largest employee group continues to be women working in a part-time capacity (42.38 per cent).
| Full-time - Female % | Full-time - Male % | Part-time - Female % | Part-time - Male % |
|---|---|---|---|
| 27.86 | 22.29 | 42.38 | 7.47 |
Paid Headcount by Age and Gender
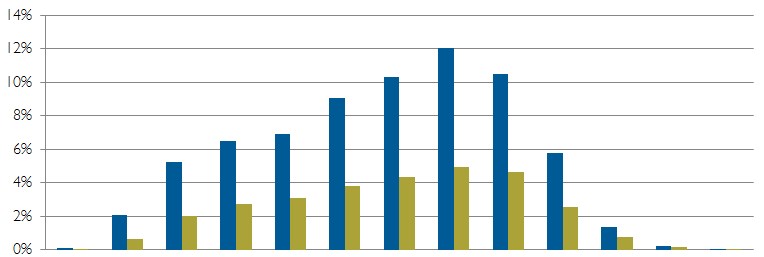
19 and less | 20 to 24 | 25 to 29 | 30 to 34 | 35 to 39 | 40 to 44 | 45 to 49 | 50 to 54 | 55 to 59 | 60 to 64 | 65 to 69 | 70 to 74 | 75 and over | Total | |
Female | 0.09% | 2.07% | 5.26% | 6.50% | 6.92% | 9.07% | 10.31% | 12.06% | 10.51% | 5.81% | 1.36% | 0.23% | 0.06% | 70.25% |
Male | 0.02% | 0.66% | 2.04% | 2.72% | 3.10% | 3.79% | 4.36% | 4.94% | 4.65% | 2.53% | 0.77% | 0.14% | 0.03% | 29.75% |
Where we work
The Department of Education continues to have the largest number of employees at 10 128, while the Macquarie Point Development Corporation has the smallest at nine.
Paid Headcount by Agency and Employment Category
Agency | Fixed-term | Permanent | Senior Exec | Total |
|---|---|---|---|---|
Department of Education | 1 909 | 8 204 | 15 | 10 128 |
Department of Health and Human Services | 96 | 1 671 | 24 | 1 791 |
Department of Justice | 58 | 1 094 | 21 | 1 173 |
Department of Police and Emergency Management | 27 | 796 | 8 | 831 |
Department of Premier and Cabinet | 29 | 353 | 25 | 407 |
Department of Primary Industries, Parks, Water and Environment | 74 | 1 259 | 15 | 1 348 |
Department of State Growth*** | 44 | 746 | 26 | 816 |
Department of Treasury and Finance | 22 | 252 | 16 | 290 |
Tasmanian Audit Office | 13 | 30 | 2 | 45 |
Integrity Commission of Tasmania | 2 | 11 | 1 | 14 |
Macquarie Point Development Corporation | 1 | 6 | 2 | 9 |
Port Arthur Historic Site Management Authority | 18 | 102 | 2 | 122 |
Tasmanian Health Organisation - North | 463 | 2 620 | 4 | 3 087 |
Tasmanian Health Organisation - South | 842 | 4 010 | 11 | 4 863 |
Tasmanian Health Organisation - North West | 288 | 1 332 | 3 | 1 623 |
TasTAFE | 142 | 719 | 4 | 865 |
The Public Trustee | 5 | 53 | 2 | 60 |
Tourism Tasmania**** | 2 | 53 | 2 | 57 |
Total | 4 035 | 23 311 | 183 | 27 529 |
*** The Department of State Growth was established from 1 July 2014 following the amalgamation of the Department of Economic Development, Tourism and the Arts, and the Department of Infrastructure, Energy and Resources.
**** Tourism Tasmania was established as a State Authority from 1 July 2014.
Paid Headcount by Region and Employment Category
Employee numbers reduced across the State by a total paid headcount of 781 (2.84 per cent). The largest reduction of 527 employees occurred in the South (1.91 per cent), and the smallest reduction was on the West Coast with 22 employees leaving the service (0.08 per cent).
Region | Fixed-term | Permanent | Senior Exec | Total |
|---|---|---|---|---|
North | 1 044 | 5 821 | 7 | 6 872 |
North West | 793 | 4 246 | 4 | 5 043 |
South | 1 896 | 11 959 | 169 | 14 024 |
South East | 258 | 1 161 | 3 | 1 422 |
West Coast | 44 | 124 | - | 168 |
Total | 4 035 | 23 311 | 183 | 27 529 |
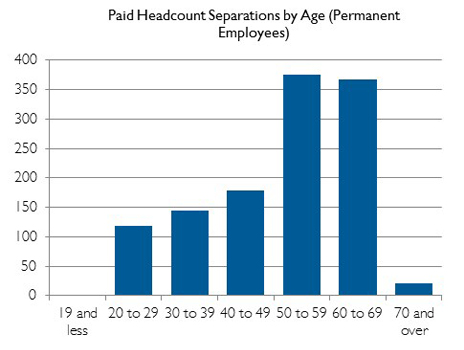
SEPARATIONS AND COMMENCEMENTS
Of the 1 208 permanent employees who left the State Service in 2014-15, a total of 523 (43.29 percent) resigned.
 |  |
Resignations do not include employees who accepted a Workforce Renewal Incentive Program payment or Voluntary Redundancy package.
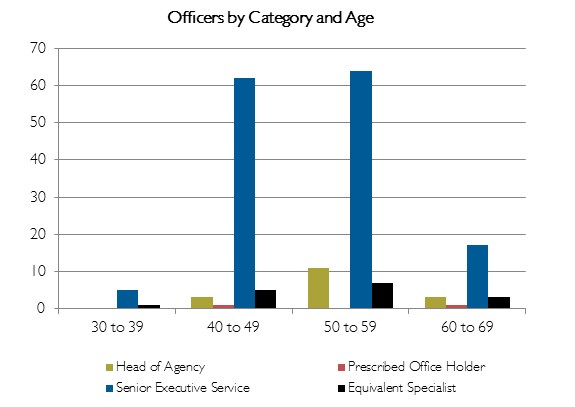
OFFICERS
An Officer is anyone appointed under Part 6 of the State Service Act 2000 and includes Heads of Agency, Prescribed Office Holders, members of the Senior Executive Service, and Equivalent Specialists.
At the end of the 2014-15, period there were 17 fewer Officers in the State Service when compared with the previous financial year, the majority of this reduction was in the Senior Executive Service which decreased by a total of 12 during the period.
| Type | 2015 - Female | 2015 - Male | Total |
|---|---|---|---|
| Head of Agency | 4 | 13 | 17 |
| Prescribed Office Holder | 0 | 2 | 2 |
| Senior Executive Service | 44 | 104 | 148 |
| Equivalent Specialist | 5 | 11 | 16 |
More information
For more information on any of the information contained in this profile, contact the State Service Management Office via email to ssmo@dpac.tas.gov.au.
Definitions
Paid headcount is the number of employees and Officers (excluding casuals) engaged and paid as at the reporting date, including employees on paid leave. It excludes employees on Leave Without Pay or on secondment. For example, an employee who works two part-time jobs will be counted as two employees.
Paid full-time equivalent (FTE) is the full-time equivalent value of employees and Officers (excluding casuals) who are engaged and paid as at the reporting date. For example, two employees working part-time at a value of 0.5 FTE will equal 1.0 FTE.
"Senior Exec” refers to any Head of Agency, Prescribed Office Holder, member of the Senior Executive Service, or Equivalent Specialist appointed under Part 6 of the State Service Act 2000.
Data Comparisons
The Tasmanian State Service Workforce Profile reflects information collected through the Workplace Analysis and Collection Data Application (WACA) system. WACA figures are a standardised national employee reporting system which is derived from quarterly snapshots of agency payroll data, in accordance with defined reporting standards. Data in the WACA is validated against a set of business rules and translation tables to ensure consistent reporting at a whole-of-service level. WACA data includes only those employees appointed under the State Service Act 2000 and employed within the agencies and authorities listed in Schedule 1 of that Act.
.