

Divisions
- About the Tasmanian State Service
- Contact Us
- Aboriginal employment
- Culture of learning
- Diversity and inclusion
- Digital capability
- Employee surveys
- Employment arrangements
- Employment policy
- Managing performance
- Work health, safety and wellbeing
- Workforce planning and reporting
- Awards and Agreements
- Managing and leading change
- Senior Executives
- Legislation
- Coronavirus (COVID-19) Information for Staff
Contact Details
By phone
Find the number of a specific division or office to contact them directly or call Service Tasmania on 1300 135 513.
Our staff
Use the Tasmanian Government Directory to find staff contact details
Social media
Follow our social media accounts to keep up to date with specific programs and initiatives.
State Service Workforce Report No 1 of 2019
Employees by Agency and Employment Category
Paid Headcount as at 31 December 2018
Agency | Fixed-term | Permanent | Officer | Total |
|---|---|---|---|---|
Department of Communities Tasmania | 84 | 748 | 15 | 847 |
Department of Education | 695 | 8,560 | 22 | 9,277 |
Department of Health | 2,173 | 9,957 | 32 | 12,162 |
Department of Justice | 137 | 1,209 | 24 | 1,370 |
Department of Police, Fire and Emergency Management | 63 | 852 | 10 | 925 |
Department of Premier and Cabinet | 44 | 416 | 18 | 478 |
Department of Primary Industries, Parks, Water and Environment | 230 | 1,146 | 20 | 1,396 |
Department of State Growth | 58 | 759 | 26 | 843 |
Department of Treasury and Finance | 32 | 286 | 15 | 333 |
Tasmanian Audit Office | 16 | 26 | 2 | 44 |
Integrity Commission of Tasmania | 1 | 12 | 1 | 14 |
Macquarie Point Development Corporation | 4 | 4 | 2 | 10 |
Port Arthur Historic Site Management Authority | 62 | 134 | 2 | 198 |
TasTAFE | 80 | 698 | 6 | 784 |
The Public Trustee | 9 | 44 | 1 | 54 |
Tourism Tasmania | 8 | 54 | 2 | 64 |
Total | 3,696 | 24,905 | 198 | 28,799 |
Compared to the total paid headcount (PHC) of 30,323 as at 30 June 2018 there has been an overall decrease of 1,524 PHC in the period. The decrease occurred in the fixed-term category (from 5,500 PHC in June), and can be mostly attributed to the seasonal conclusion of fixed-term contracts, which occurs at the end of each calendar year.
Paid Full-time Equivalent as at 31 December 2018
Agency | Fixed-term | Permanent | Officer | Total |
|---|---|---|---|---|
Department of Communities Tasmania | 72.71 | 676.29 | 15.00 | 764.00 |
Department of Education | 455.28 | 6,607.36 | 21.80 | 7,084.44 |
Department of Health and Human Services | 1,638.55 | 7,662.96 | 32.00 | 9,333.51 |
Department of Justice | 126.01 | 1,114.05 | 23.76 | 1,263.82 |
Department of Police, Fire and Emergency Management | 57.58 | 817.73 | 10.00 | 885.31 |
Department of Premier and Cabinet | 37.07 | 352.52 | 17.90 | 407.49 |
Department of Primary Industries, Parks, Water and Environment | 183.09 | 1,050.42 | 20.00 | 1,253.51 |
Department of State Growth | 52.49 | 644.75 | 25.10 | 722.34 |
Department of Treasury and Finance | 30.26 | 264.15 | 15.00 | 309.41 |
Tasmanian Audit Office | 15.30 | 24.60 | 2.00 | 41.90 |
Integrity Commission of Tasmania | 1.00 | 10.90 | 0.80 | 12.70 |
Macquarie Point Development Corporation | 4.00 | 2.77 | 2.00 | 8.77 |
Port Arthur Historic Site Management Authority | 32.17 | 107.22 | 2.00 | 141.39 |
TasTAFE | 57.58 | 602.74 | 6.00 | 666.32 |
The Public Trustee | 8.40 | 40.43 | 1.00 | 49.83 |
Tourism Tasmania | 8.00 | 46.19 | 2.00 | 56.19 |
Total | 2,779.49 | 20,025.08 | 196.36 | 23,000.93 |
The total paid FTE decreased by 899.44 in the December quarter from 23,900.37 paid FTE as at 30 June 2018. The current paid FTE shows an increase of 931.98 paid FTE when compared to December 2017.
Paid Headcount across the State Service
Percentage of total Paid Headcount by Employment Status
Our largest employee group continues to be women working in a part-time capacity (42.10 per cent). There has been a slight increase in full-time employment (2.06 per cent) since June 2018.
Female % | Male % | |
|---|---|---|
Full-time | 28.57 | 21.84 |
Part-time | 42.10 | 7.48 |
Paid Headcount by Age and Gender
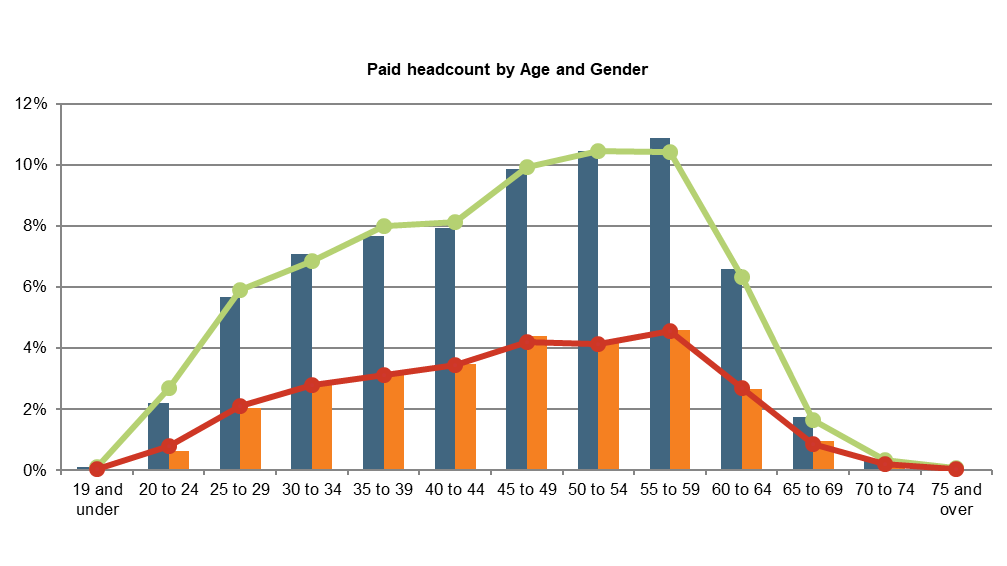
The gender balance shifted slightly between 30 June and 31 December 2018, with the number of female employees decreasing from 70.95 per cent to 70.67 per cent, compared to the number of male employees which increased from 29.05 per cent to 29.32 per cent. The number of employees under the age of 30 also decreased from 11.67 per cent as at 30 June to 10.71 per cent in December (increasing from 10.58 per cent as at 31 December 2017).
The average length of service for permanent employees decreased slightly to 13.51 years in December compared to 13.64 years as at 30 June 2018.
| Dec - Female | Dec - Male | June - Female | June - Male |
|---|---|---|---|---|
19 and under | 0.07% | 0.03% | 0.09% | 0.04% |
20 to 24 | 2.17% | 0.63% | 2.58% | 0.82% |
25 to 29 | 5.59% | 2.09% | 5.80% | 2.01% |
30 to 34 | 6.70% | 2.84% | 6.85% | 2.80% |
35 to 39 | 7.49% | 3.12% | 7.61% | 3.12% |
40 to 44 | 7.80% | 3.49% | 8.19% | 3.43% |
45 to 49 | 10.11% | 4.47% | 10.22% | 4.42% |
50 to 54 | 10.96% | 4.40% | 10.75% | 4.31% |
55 to 59 | 11.06% | 4.74% | 10.57% | 4.52% |
60 to 64 | 6.47% | 2.65% | 6.30% | 2.69% |
65 to 69 | 1.65% | 0.83% | 1.47% | 0.77% |
70 to 74 | 0.31% | 0.20% | 0.34% | 0.18% |
75 and over | 0.10% | 0.03% | 0.09% | 0.04% |
Total | 70.48% | 29.52% | 70.86% | 29.14% |
Paid Headcount by Region and Employment Category
Employee numbers decreased by a total paid headcount of 1,528 (-5.03 per cent) as at 31 December 2018. When compared to 30 June 2018, a decrease in every region across the State can be noted.
Region | Fixed-term | Permanent | Officer | Total |
|---|---|---|---|---|
Interstate | - | - | - | - |
North | 853 | 6,192 | 13 | 7,058 |
North West | 536 | 4,369 | 3 | 4,908 |
South | 2,074 | 12,973 | 179 | 15,226 |
South East | 223 | 1,223 | 3 | 1,449 |
West Coast | 10 | 148 | - | 158 |
Total | 3,696 | 24,905 | 198 | 28,799 |
Separations and Commencements
Of the 369 permanent employees who left the State Service in the quarter ending 31 December 2018, a total of 362 (95.93 per cent) resigned. The following charts show the number of permanent employees who left the State Service, and commencements with the State Service in the quarter ending 31 December 2018 by age group, and compared to the quarter ending 30 June 2018.
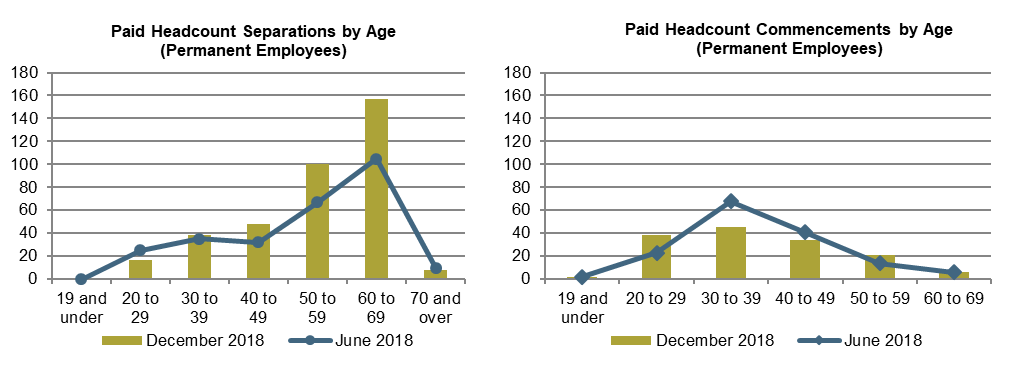
Resignations include employees who accepted a Workforce Renewal Incentive Program payment or Voluntary Redundancy package, resigned or retired from the State Service.
Officers
An Officer is anyone appointed under Part 6 of the State Service Act 2000 and includes Heads of Agency, Prescribed Office Holders, members of the Senior Executive Service, and Equivalent Specialists.
As at 31 December 2018 the total number of Officers in the State Service was 198 compared to 185 as at 30 June 2018 [1].
Type | Female | Male | Total |
|---|---|---|---|
Head of Agency | 5 | 10 | 15 |
Prescribed Office Holder | 1 | 1 | 2 |
Senior Executive Service | 65 | 92 | 157 |
Equivalent Specialist | 8 | 16 | 24 |
Total | 79 | 119 | 198 |
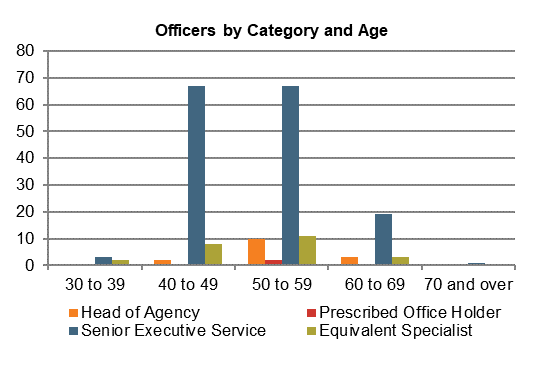
[1] Following a review and validation of the coding of officers within agency payroll systems, amendments to the employment code of some employees and officers were made to correctly reflect their appointment type. This has resulted in an artificial increase in the number of officers in the December 2018 quarter.
More Info
For more information on any of the information contained in this profile, contact the State Service Management Office via email at ssmo@dpac.tas.gov.au.
The next State Service Workforce Report will be published in October 2019.