

Divisions
- About the Tasmanian State Service
- Contact Us
- Aboriginal employment
- Culture of learning
- Diversity and inclusion
- Digital capability
- Employee surveys
- Employment arrangements
- Employment policy
- Managing performance
- Work health, safety and wellbeing
- Workforce planning and reporting
- Awards and Agreements
- Managing and leading change
- Senior Executives
- Legislation
- Coronavirus (COVID-19) Information for Staff
Contact Details
By phone
Find the number of a specific division or office to contact them directly or call Service Tasmania on 1300 135 513.
Our staff
Use the Tasmanian Government Directory to find staff contact details
Social media
Follow our social media accounts to keep up to date with specific programs and initiatives.
State Service Workforce Report No 1 of 2017
Employees by Agency and Employment Category
Paid Headcount as at 31 December 2016
This compares to 28,000 in June 2016. The largest reduction occurred in the fixed-term category (from 4,472 in June), this reduction can be mostly attributed to the seasonal conclusion of fixed-term contracts, which occurs at the end of each calendar year.
Agency | Fixed-term | Permanent | Senior Exec | Total |
|---|---|---|---|---|
Department of Education | 449 | 8,326 | 14 | 8,789 |
Department of Health and Human Services | 125 | 1,731 | 26 | 1,882 |
Department of Justice | 103 | 1,134 | 23 | 1,260 |
Department of Police, Fire and Emergency Management | 58 | 811 | 10 | 879 |
Department of Premier and Cabinet | 37 | 475 | 22 | 534 |
Department of Primary Industries, Parks Water and Environment | 172 | 1,093 | 18 | 1,283 |
Department of State Growth | 33 | 748 | 24 | 805 |
Department of Treasury and Finance | 24 | 236 | 16 | 276 |
Tasmanian Audit Office | 13 | 29 | 2 | 44 |
Integrity Commission of Tasmania | 1 | 11 | 1 | 13 |
Macquarie Point Development Corporation | 3 | 7 | 1 | 11 |
Port Arthur Historic Site Management Authority | 28 | 100 | 2 | 130 |
Tasmanian Health Service | 1,808 | 8,076 | 16 | 9,900 |
TasTAFE | 54 | 694 | 5 | 753 |
The Public Trustee | 4 | 52 | 1 | 57 |
Tourism Tasmania | 3 | 54 | 1 | 58 |
Total | 2,915 | 23,577 | 182 | 26,674 |
Paid FTEs as at 31 December 2017
As at December 2016 the Tasmanian State Service has a total paid FTE of 21,355.45 compared to 22,135.01 in June 2016 and which equates to a difference of -799.56 paid FTEs (20,629.20 in December 2015). [1]
Agency | Fixed-term | Permanent | Senior Exec | Total |
|---|---|---|---|---|
Department of Education | 257.68 | 6,395.19 | 14.00 | 6,666.87 |
Department of Health and Human Services | 102.11 | 1,536.06 | 26.00 | 1,664.17 |
Department of Justice | 90.96 | 1,030.77 | 22.60 | 1,144.33 |
Department of Police, Fire and Emergency Management | 50.99 | 778.27 | 10.00 | 839.26 |
Department of Premier and Cabinet | 33.47 | 409.65 | 21.90 | 465.02 |
Department of Primary Industries, Parks, Water, and Environment | 140.45 | 1,003.14 | 18.00 | 1,161.59 |
Department of State Growth | 28.52 | 637.72 | 23.94 | 690.18 |
Department of Treasury and Finance | 24.00 | 237.00 | 16.00 | 277.00 |
Tasmanian Audit Office | 12.50 | 26.00 | 2.00 | 40.50 |
Integrity Commission of Tasmania | 1.00 | 10.60 | 1.00 | 12.60 |
Macquarie Point Development Corporation | 3.00 | 6.16 | 1.00 | 10.16 |
Port Arthur Historic Site Management Authority | 28.00 | 100.00 | 2.00 | 130.00 |
Tasmanian Health Service | 1,347.26 | 6,150.35 | 16.00 | 7,513.61 |
TasTAFE | 39.01 | 594.32 | 5.00 | 638.33 |
The Public Trustee | 4.00 | 46.09 | 1.00 | 51.09 |
Tourism Tasmania | 3.00 | 46.74 | 1.00 | 50.74 |
Total | 2,165.95 | 19,008.06 | 181.44 | 21,355.45 |
Paid Headcount across the State Service
Percentage of total Paid Headcount by Employment Status
Our largest employee group continues to be women working in a part-time capacity (41.76 per cent). There has been a slight increase in full-time employment (1.72 per cent) over the period since June 2016.
| Female % | Male % |
|---|---|---|
Full-time | 28.72 | 22.56 |
Part-time | 41.76 | 6.95 |
Paid Headcount by Age and Gender
The gender balance shifted slightly during the December quarter, with the number of female employees dropping from 70.56 per cent in June to 70.48 per cent, compared to the number of male employees which rose from 29.44 per cent to 29.52 per cent. The number of employees under the age of 30 also dropped slightly from 10.57 per cent in June to 9.83 per cent in December (9.41 per cent in December 2015).
The average length of service for permanent employees fell slightly to 13.87 years in December compared to 13.92 years in June.
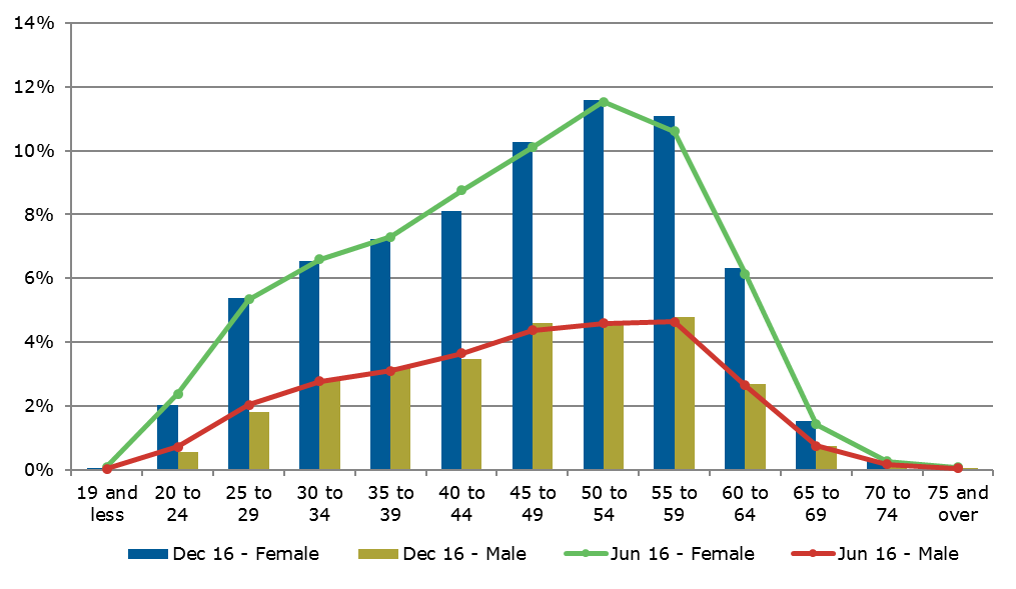
Age Group | Jun 16 - Female | Jun 16 - Male | Dec 16 - Female | Dec 16 - Male |
|---|---|---|---|---|
19 and less | 0.09% | 0.02% | 0.04% | 0.03% |
20 to 24 | 2.38% | 0.72% | 2.04% | 0.54% |
25 to 29 | 5.34% | 2.03% | 5.38% | 1.80% |
30 to 34 | 6.59% | 2.76% | 6.55% | 2.82% |
35 to 39 | 7.30% | 3.10% | 7.23% | 3.20% |
40 to 44 | 8.76% | 3.64% | 8.12% | 3.48% |
45 to 49 | 10.10% | 4.37% | 10.26% | 4.58% |
50 to 54 | 11.52% | 4.58% | 11.58% | 4.64% |
55 to 59 | 10.61% | 4.64% | 11.09% | 4.78% |
60 to 64 | 6.13% | 2.64% | 6.32% | 2.68% |
65 to 69 | 1.42% | 0.75% | 1.53% | 0.75% |
70 to 74 | 0.26% | 0.17% | 0.27% | 0.17% |
75 and over | 0.07% | 0.04% | 0.07% | 0.04% |
Paid Headcount by Region and Employment Category
Employee numbers reduced across the State by a total paid headcount of 1,326 (4.74 per cent). When compared to the June quarter a reduction across all regions can be noted.
Region | Fixed-term | Permanent | Senior Exec | Total |
|---|---|---|---|---|
Interstate | 1 | - | - | 1 |
North | 771 | 5,896 | 9 | 6,676 |
North West | 420 | 4,257 | 3 | 4,680 |
South | 1,573 | 12,107 | 167 | 13,847 |
South East | 135 | 1,176 | 3 | 1,314 |
West Coast | 15 | 141 | - | 156 |
Total | 2,915 | 23,577 | 182 | 26,674 |
Separations and Commencements
The following charts show the number of permanent employees who left the State Service, and commencements with the State Service in the December reporting period by age group, and compared to the June quarter.
Paid Headcount Separations by Age (Permanent Employees)
Of the 377 permanent employees who left the State Service in the December reporting period, a total of 371 (98.41 percent) resigned. Resignations include employees who accepted a Workforce Renewal Incentive Program payment or Voluntary Redundancy package, resigned or retired from the State Service.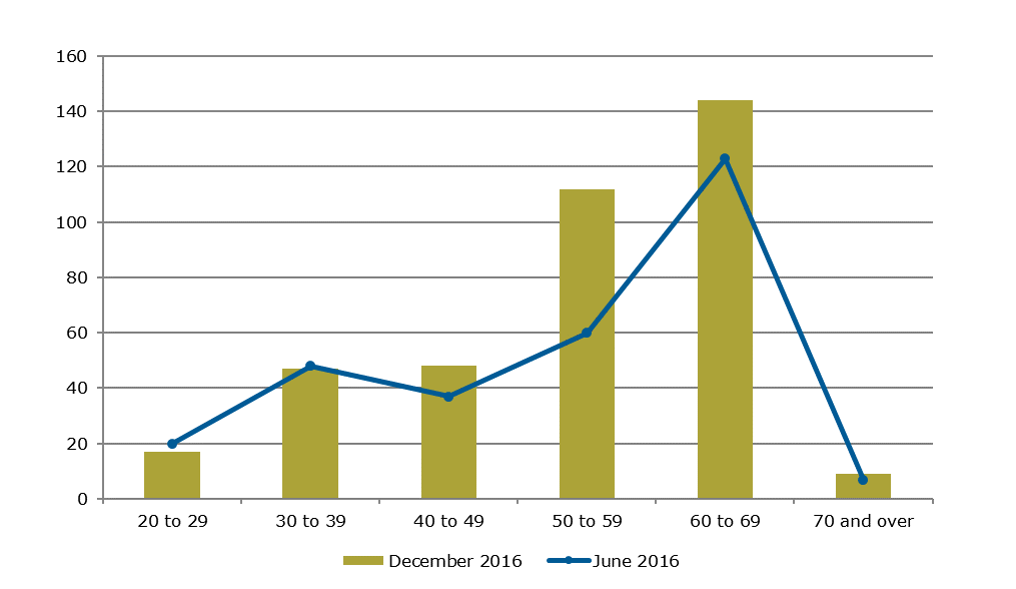
Paid Headcount Commencements by Age (Permanent Employees)
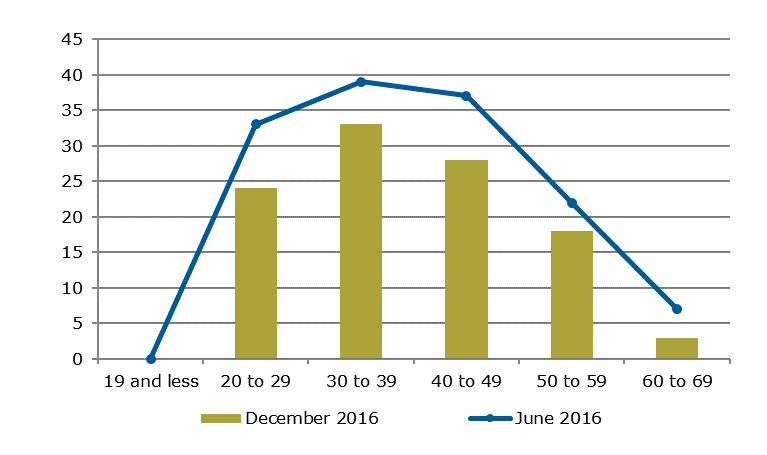
Note: The Paid Headcount Commencements by Age (Permanent Employees) chart has been updated as of May 2017 to rectify an inconsistency in data reporting.
Officers
An Officer is anyone appointed under Part 6 of the State Service Act 2000 and includes Heads of Agency, Prescribed Office Holders, members of the Senior Executive Service, and Equivalent Specialists.
Officers by Category and Age
At the end of the December 2016 quarter the number of Officers in the State Service decreased by one when compared with the June quarter.
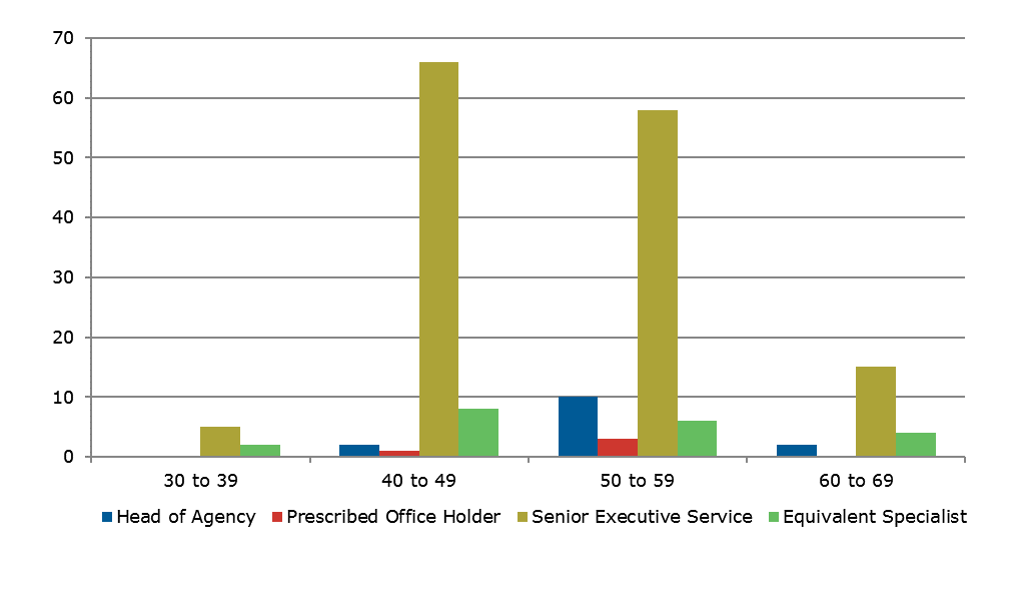
December 2016
Type | Female | Male | Total |
|---|---|---|---|
Head of Agency | 1 | 13 | 14 [2] |
Prescribed Office Holder | 1 | 3 | 4 |
Senior Executive Service | 51 | 93 | 144 |
Equivalent Specialist | 5 | 15 | 20 |
Total | 58 | 124 | 182 |
More Info
For more information on any of the information contained in this profile, contact the State Service Management Office via email to ssmo@dpac.tas.gov.au.
The next State Service Workforce Report will be published in October 2017.
[1] The Tasmanian State Service Workforce Profile presents information collected through the Workplace Information Reporting System (WiRS). Other State Service reported data on Paid FTEs is collected using different capture rules and requirements, such as rules for calculating casuals. It excludes Tasmanian Police Officers, Ministerial and Parliamentary staff and this report only provides for employees under the State Service Act 2000.
[2] The reduction by one Head of Agency is the result of interim arrangements following the departure of the CEO, Macquarie Point Management Authority not having commenced as at the data collection date.