

Divisions
- About the Tasmanian State Service
- Contact Us
- Aboriginal employment
- Culture of learning
- Diversity and inclusion
- Digital capability
- Employee surveys
- Employment arrangements
- Employment policy
- Managing performance
- Work health, safety and wellbeing
- Workforce planning and reporting
- Awards and Agreements
- Managing and leading change
- Senior Executives
- Legislation
- Coronavirus (COVID-19) Information for Staff
Contact Details
By phone
Find the number of a specific division or office to contact them directly or call Service Tasmania on 1300 135 513.
Our staff
Use the Tasmanian Government Directory to find staff contact details
Social media
Follow our social media accounts to keep up to date with specific programs and initiatives.
Appendix 1 – Workforce Profile
As at June 2017, the State Service had a total paid headcount[1] of 29,075 (28,000 in 2016), which equates to a total of 22,977.32 paid full-time equivalent (FTE) employees (22,135.01 in 2016). This is an increase of 842.31 FTE in the twelve months to June 2017.
Paid FTE by agency as at 30 June 2016 and 2017
2016 | 2017 | Variation 2016-17 | |
|---|---|---|---|
Department of Education | 7,644.95 | 7,952.85 | 307.90 |
Department of Health and Human Services | 1,631.46 | 1,607.33 | - 24.13 |
Department of Justice | 1,107.46 | 1,142.02 | 34.56 |
Department of Police, Fire and Emergency Management | 786.22 | 852.74 | 66.52 |
Department of Premier and Cabinet | 458.23 | 474.05 | 15.82 |
Department of Primary Industries, Parks, Water and Environment | 1,091.97 | 1,156.96 | 64.99 |
Department of State Growth | 678.22 | 703.75 | 25.53 |
Department of Treasury and Finance | 260.03 | 291.49 | 31.46 |
Tasmanian Audit Office | 43.00 | 39.08 | - 3.92 |
Integrity Commission of Tasmania | 14.40 | 12.90 | - 1.50 |
Macquarie Point Development Corporation | 11.16 | 3.00 | - 8.16 |
Port Arthur Historic Site Management Authority | 98.19 | 92.33 | - 5.86 |
Tasmanian Health Service[2] | 7,498.56 | 7,849.76 | 351.20 |
TasTAFE | 711.81 | 695.08 | - 16.73 |
The Public Trustee | 50.59 | 53.62 | 3.03 |
Tourism Tasmania | 48.76 | 50.36 | 1.60 |
Total | 22,135.01 | 22,977.32 | 842.31 |
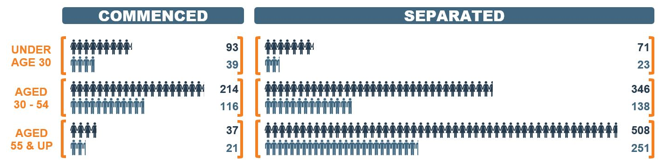
The total number of employees under age 30 increased to 3,293 in 2016-17 (from 2,959 in 2015-16).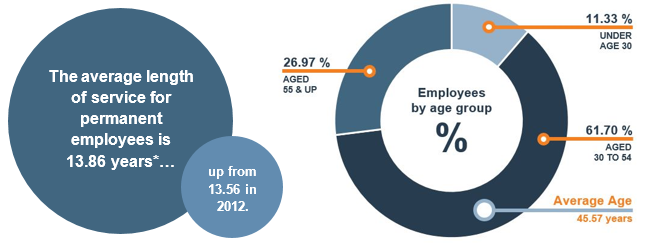
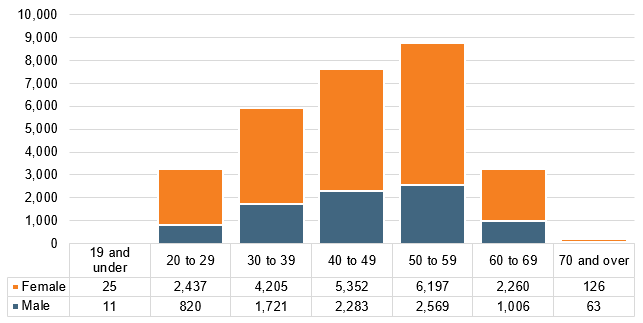
Paid Headcount by age and gender
Paid Headcount by agency and employment category
Fixed-term | Permanent | Part 6 | TOTAL | |
|---|---|---|---|---|
Department of Education | 2,485 | 8,237 | 14 | 10,736 |
Department of Health and Human Services | 147 | 1,600 | 28 | 1,775 |
Department of Justice | 98 | 1,136 | 23 | 1,257 |
Department of Police, Fire and Emergency Management | 61 | 821 | 10 | 892 |
Department of Premier and Cabinet | 57 | 468 | 18 | 543 |
Department of Primary Industries, Parks, Water and Environment | 141 | 1,110 | 20 | 1,271 |
Department of State Growth | 44 | 752 | 24 | 820 |
Department of Treasury and Finance | 23 | 276 | 16 | 315 |
Tasmanian Audit Office | 10 | 30 | 2 | 42 |
Integrity Commission of Tasmania | 1 | 12 | 1 | 14 |
Macquarie Point Development Corporation | 2 | - | 1 | 3 |
Port Arthur Historic Site Management Authority | 10 | 108 | 2 | 120 |
Tasmanian Health Service | 1,964 | 8,360 | 20 | 10,344 |
TasTAFE | 131 | 686 | 6 | 823 |
The Public Trustee | 7 | 53 | 1 | 61 |
Tourism Tasmania | 4 | 53 | 2 | 59 |
Total | 5,185 | 23,702 | 188 | 29,075 |
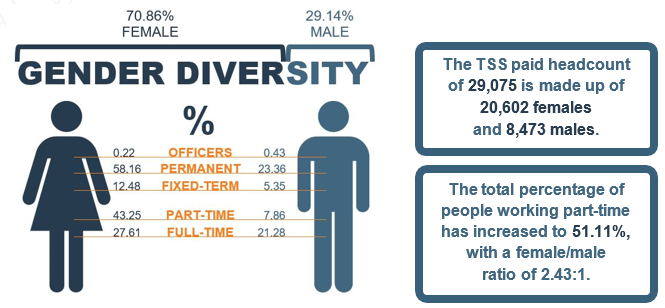
Employment status by region as a percentage of the TSS workforce
| Fixed-term % | Permanent % | Part 6 % |
|---|---|---|---|
Interstate | 0.00 | 0.00 | 0.00 |
North | 4.23 | 20.47 | 0.03 |
North West | 3.27 | 14.53 | 0.01 |
South | 9.09 | 41.97 | 0.59 |
South East | 1.14 | 4.04 | 0.01 |
West Coast | 0.10 | 0.52 | 0.00 |
Total % of TSS | 17.83 | 81.53 | 0.64 |
Commencements and separations
Of the 1,337 permanent employees who left the State Service in 2016-17, a total of 1,192 (89.15 per cent) resigned[3] or retired.
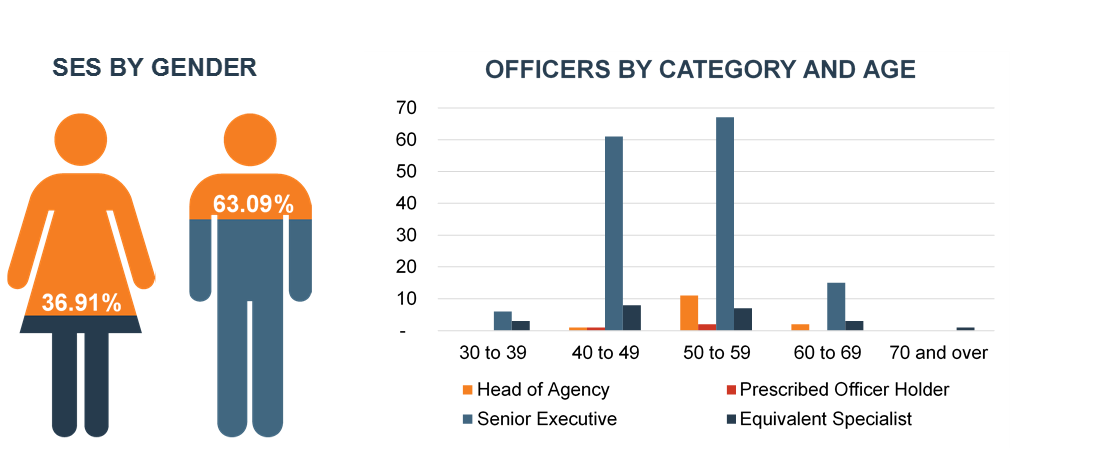
Officers
An officer is anyone appointed under Part 6 of the Act, and includes Heads of Agencies, Prescribed Office Holders, Senior Executive Service, and Equivalent Specialists. Overall, the total number of officers in the State Service rose over the 2016-17 reporting period to 188 (from 183 in 2015-16). Senior Executive Service (SES) officer numbers increased from 147 to 149, which includes an increase of female officers from 50 in 2015-16 to 55 in 2016-17.
Category | Male | Female | Total |
|---|---|---|---|
Head of Agency | 13 | 1 | 14 |
Prescribed Office Holder | 2 | 1 | 3 |
Senior Executive Service | 94 | 55 | 149 |
Equivalent Specialist | 16 | 6 | 22 |
Total | 125 | 63 | 188 |
Data notes
Data included in this Workforce Profile reflects information collected through the Workforce Information Reporting System (WiRS). WiRS is a standardised national employee reporting system, validated against a set of business rules and translation tables to ensure consistent reporting at a whole-of-service level. WiRS data only includes those people employed under the State Service Act 2000, and within the agencies listed in Schedule 1 of that Act.
Definitions
Paid Headcount is the number of employees and officers (excluding casuals) engaged and paid as at the reporting date, including employees on paid leave. It excludes employees who were not paid as at the reporting date, such as people on Leave Without Pay or on secondment out of the State Service.
Paid Full-time Equivalent (FTE) is the full-time equivalent value of employees and officers (excluding casuals) who are engaged and paid as at the reporting date (e.g. one person working two part-time roles of 0.5 FTE each equals 1.00 FTE).
Officer/Part 6 is anyone appointed under Part 6 of the Act, and includes Heads of Agencies, Prescribed Office Holders, Senior Executive Service, and Equivalent Specialists.
For more information
For more information on any of the information contained in the Profile, contact SSMO via email to ssmo@dpac.tas.gov.au.
This Report can also be view electronically on the SSMO website at www.dpac.tas.gov.au/divisions/ssmo/publications.
[1] Unless otherwise stated all totals and averages are based on paid permanent and fixed-term employee numbers and exclude casual employees. A full definition appears at the end of this chapter.
[2] Part of this increase is due to the transfer of the Child Health and Parenting Service (CHaPS) from DHHS to the THS effective as at 1 January 2017.
[3] Does not include employees who accepted a Workforce Renewal Incentive Program payment or Voluntary Redundancy package.