

Divisions
- About the Tasmanian State Service
- Contact Us
- Aboriginal employment
- Culture of learning
- Diversity and inclusion
- Digital capability
- Employee surveys
- Employment arrangements
- Employment policy
- Managing performance
- Work health, safety and wellbeing
- Workforce planning and reporting
- Awards and Agreements
- Managing and leading change
- Senior Executives
- Legislation
- Coronavirus (COVID-19) Information for Staff
Contact Details
By phone
Find the number of a specific division or office to contact them directly or call Service Tasmania on 1300 135 513.
Our staff
Use the Tasmanian Government Directory to find staff contact details
Social media
Follow our social media accounts to keep up to date with specific programs and initiatives.
Appendix A - State Service Workforce Profile (June 2016)
As at June 2016, the State Service had a total paid headcount of 28,000 (27,529 in 2015), which equates to 22,135.01 paid full-time equivalent employees (FTEs) (21,736 in 2015)*. In total, the year 2015-16 saw an increase of 399.01 paid FTEs across the State Service.
| Agency | 2015 | 2016 | Variation 2015-16 |
|---|---|---|---|
| Department of Education** | 7,469.06 | 7,644.95 | 175.89 |
| Department of Health and Human Services** | 1,595.08 | 1,631.46 | 36.38 |
| Department of Justice** | 1,046.66 | 1,107.46 | 60.80 |
| Department of Police, Fire and Emergency Management | 792.28 | 786.22 | - 6.06 |
| Department of Premier and Cabinet*** | 354.63 | 458.23 | 103.60 |
| Department of Primary Industries, Parks, Water and the Environment*** | 1,180.24 | 1,091.97 | - 88.27 |
| Department of State Growth | 702.43 | 678.22 | - 24.21 |
| Department of Treasury and Finance | 266.30 | 260.03 | - 6.27 |
| Tasmanian Audit Office | 42.04 | 43.00 | 0.96 |
| Integrity Commission of Tasmania | 13.10 | 14.40 | 1.30 |
| Macquarie Point Development Corporation | 8.40 | 11.16 | 2.76 |
| Port Arthur Historic Site Management Authority | 90.11 | 98.19 | 8.08 |
| Tasmanian Health Organisation – North | 2,314.40 | - | |
| Tasmanian Health Organisation – South | 3,769.65 | - | |
| Tasmanian Health Organisation - North West | 1,287.59 | - | |
| Tasmanian Health Service** | 7,371.64 | 7,498.56 | 126.92 |
| TasTAFE | 701.77 | 711.81 | 10.04 |
| Tourism Tasmania | 48.77 | 48.76 | - 0.01 |
| The Public Trustee | 53.49 | 50.59 | - 2.90 |
| Total | 21,736.00 | 22,135.01 | 399.01 |
*The State Service Workforce Profile outlines information from the Workforce Information Reporting System (WiRS). Unless otherwise stated, all totals and averages are based on paid permanent and fixed-term employee numbers, and exclude casual employees. Definitions are available at the end of this section.
**This increase is due to increased funding for Government initiatives and filling of positions previously made vacant through the Workplace Renewal Incentive Program (WRIPs).
***This variation reflects the transition of Service Tasmania from DPIPWE to DPAC.
The total number of employees under the age of 30 increased slightly from 2,794 to 2,959 over the year, and the average age of our workforce fell slightly from 45.82 years in 2015 to 45.74 years. For permanent employees, the average length of service fell slightly to 12.30 years from 12.46 years in 2015.
Percentage of total paid headcount by employment status
Our largest employee group continues to be women working in a part-time capacity (42.68 per cent).
| Female % (Full-time) | Male % (Full-time) | Female % (Part-time) | Male % (Part-time) |
|---|---|---|---|
| 27.88 | 21.69 | 42.68 | 7.76 |
Paid headcount by age and gender
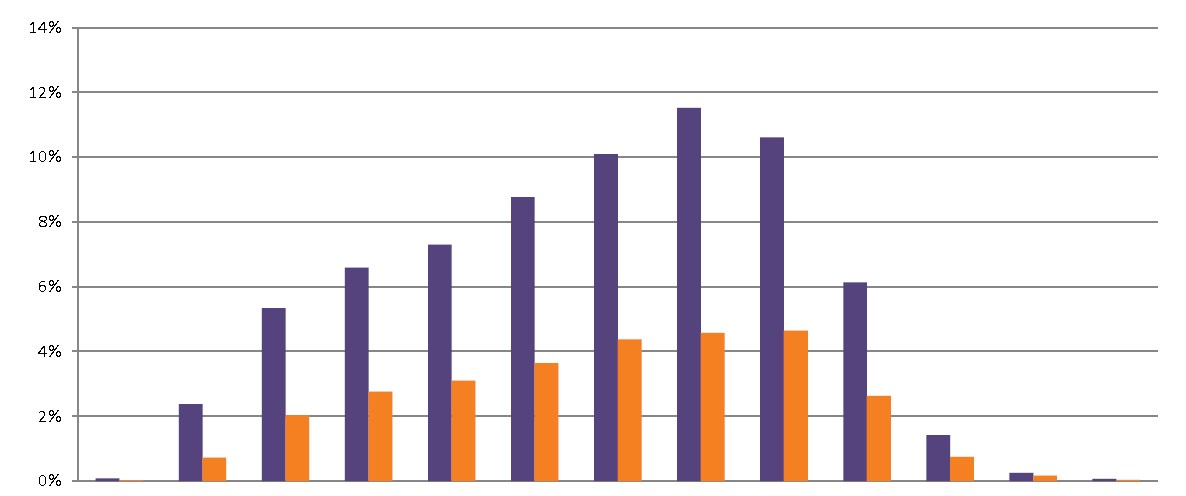
| Gender (Percentage by age group) | 19 and less | 20 to 24 | 25 to 29 | 30 to 34 | 35 to 39 | 40 to 44 | 45 to 49 | 50 to 54 | 55 to 59 | 60 to 64 | 65 to 69 | 70 to 74 | 75 and over | Total |
|---|---|---|---|---|---|---|---|---|---|---|---|---|---|---|
| Female | 0.09 | 2.38 | 5.34 | 6.59 | 7.30 | 8.76 | 10.10 | 11.52 | 10.61 | 6.13 | 1.42 | 0.26 | 0.07 | 70.56 |
| Male | 0.02 | 0.72 | 2.03 | 2.76 | 3.10 | 3.64 | 4.37 | 4.58 | 4.64 | 2.64 | 0.75 | 0.17 | 0.04 | 29.44 |
The above graph outlines that in 2015-16, 70.6 per cent of the State Service workforce was female, with 29.4 per cent male. It also highlights that in 2015-16 10.6 per cent of the State Service workforce was under 30 years and 11.5 per cent of the State Service workforce was over 60 years.
Paid headcount by agency and employment category
The Department of Education continues to have the most employees at 10,366, while the Macquarie Point Development Corporation has the least, at 12 employees.
| Agency | Fixed-term | Permanent | Senior Executives | TOTAL |
|---|---|---|---|---|
| Department of Education | 2,112 | 8,239 | 15 | 10,366 |
| Department of Health and Human Services | 101 | 1,716 | 24 | 1,841 |
| Department of Justice | 67 | 1,129 | 23 | 1,219 |
| Department of Police, Fire, and Emergency Management* | 49 | 761 | 10 | 820 |
| Department of Premier and Cabinet | 28 | 476 | 21 | 525 |
| Department of Primary Industries, Parks, Water and Environment | 101 | 1,088 | 20 | 1,209 |
| Department of State Growth | 28 | 740 | 24 | 792 |
| Department of Treasury and Finance | 23 | 245 | 15 | 283 |
| Tasmanian Audit Office | 15 | 29 | 2 | 46 |
| Integrity Commission of Tasmania | 2 | 12 | 1 | 15 |
| Macquarie Point Development Corporation | 2 | 8 | 2 | 12 |
| Port Arthur Historic Site Management Authority | 23 | 104 | 2 | 129 |
| Tasmanian Health Service** | 1,776 | 7,988 | 16 | 9,780 |
| TasTAFE | 137 | 709 | 5 | 851 |
| The Public Trustee | 5 | 51 | 1 | 57 |
| Tourism Tasmania | 3 | 50 | 2 | 55 |
| TOTAL | 4,472 | 23,345 | 183 | 28,000 |
* The Department of Police and Emergency Management updated their name to include Fire from April 2015.
**The Tasmanian Health Service replaced the three Tasmanian Health Organisations from 1 July 2015.
Paid headcount by region and employment category
Employee numbers increased across in almost all regions of the State by a total paid headcount of 471 (1.71 per cent), with the largest increase of 327 employees occurring in the South (1.18 per cent). The only reduction was in the North West which fell by 47 (0.17 per cent) compared to June 2015.
| Region | Fixed-term | Permanent | Senior Officers* | Total |
|---|---|---|---|---|
| North | 1,108 | 5,905 | 9 | 7,022 |
| North West | 817 | 4,176 | 3 | 4,996 |
| South | 2,207 | 11,976 | 168 | 14,351 |
| South East | 292 | 1,147 | 3 | 1,142 |
| West Coast | 48 | 141 | 0 | 189 |
| TOTAL | 4,472 | 23,345 | 183 | 28,000 |
Part 6 of the Act sets out Heads of Agencies, holders of prescribed offices and Senior Executives.
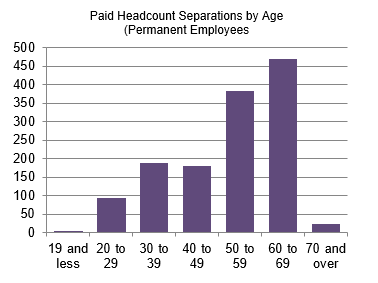
Separations and commencements
Of the 1,300 permanent employees who left the State Service in 2015-16, a total of 893 (68.69 per cent) resigned* or retired.
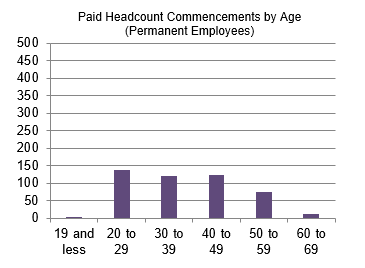
Note: The Paid Headcount Commencements by Age (Permanent Employees) chart has been updated as of May 2017 to rectify an inconsistency in data reporting.
* Resignations do not include employees who accepted a Workforce Renewal Incentive Program payment or Voluntary Redundancy package.
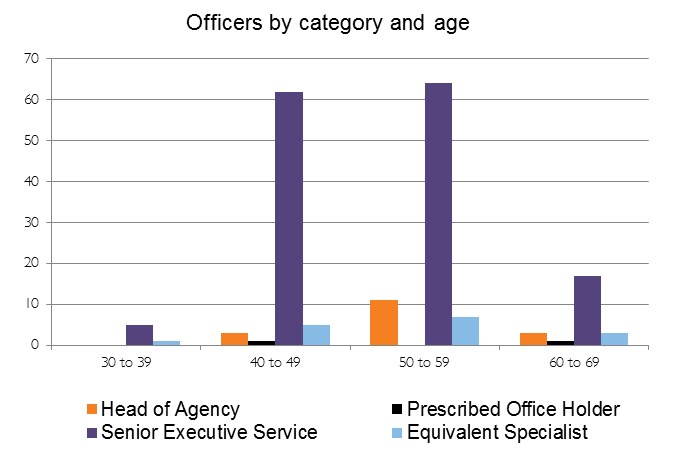
Officers
An Officer is anyone appointed under Part 6 of the State Service Act 2000 and includes Heads of Agencies, Prescribed Office Holders, members of the Senior Executive Service, and Equivalent Specialists. At the end of 2015-16, the total number of Officers in the State Service remained the same when compared with the previous financial year. The number of females SES Officers rose by six (4.28 per cent) to 50, bringing the overall number of female Officers to 56 (30.60 per cent).
| Category | Female | Male | Total |
|---|---|---|---|
| Head of Agency | 2 | 13 | 15 |
Prescribed Office Holder | 1 | 2 | 3 |
Senior Executive Service | 50 | 97 | 147 |
Equivalent Specialist | 3 | 15 | 18 |
TOTAL | 56 | 127 | 183 |
Definitions
Paid headcount is the number of employees and officers (excluding casuals) engaged and paid as at the reporting date, including employees on paid leave. It excludes employees on Leave Without Pay or on secondment (e.g.an employee who works two part-time jobs will be counted as two employees).
Paid full-time equivalent (FTE) is the full-time equivalent value of employees and officers (excluding casuals) who are engaged and paid as at the reporting date (e.g. two employees working part-time at a value of 0.5 FTE equals 1.0 FTE).
‘Part 6’ refers to any Head of Agency, Prescribed Office Holder, member of the Senior Executive Service, or Equivalent Specialist appointed under Part 6 of the State Service Act 2000.
The Workforce Profile includes information collected through the Workforce Information Reporting System (WiRS). WiRS figures are a standardised national employee reporting system which is derived from quarterly snapshots of agency payroll data. WiRS data is validated against a set of business rules and translation tables to ensure consistent reporting at a whole-of-service level. WiRS data includes only those employees appointed under the State Service Act 2000 and employed within the agencies listed in Schedule 1 of that Act.
More information
For more information on any of the information contained in this profile, contact the State Service Management Office via email to ssmo@dpac.tas.gov.au